The latest leg down pushed $SOL from the low $120s into the $100 area in a fast sequence of red candles. At the same time, the volume bars expanded into the selloff, including a visible spike near the recent drop, which signals heavier turnover as price broke into a new local low zone.
Solana tests key support as chart debates double bottom versus deeper retrace
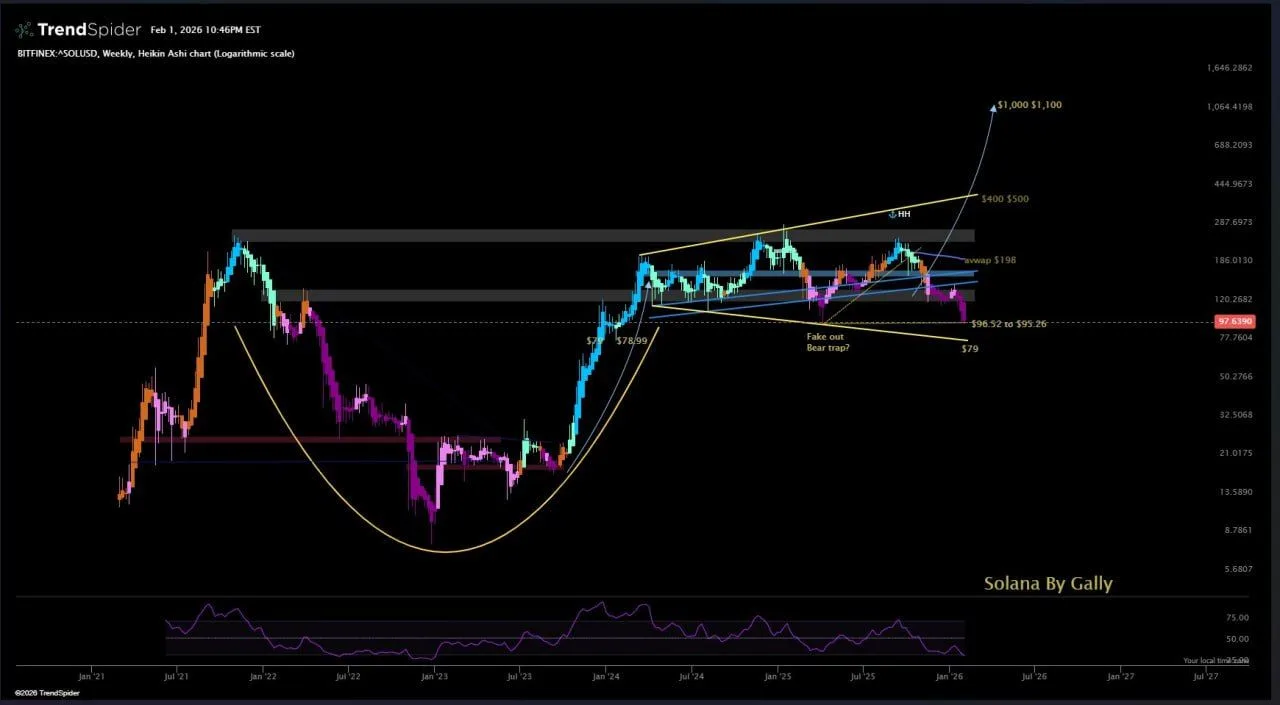
The weekly chart shared by market analyst Gally shows $SOL pulling back into a long-term support band after failing to hold above the $180–$200 region. Price has moved steadily lower since mid-January, breaking below trend support and sliding toward the high $90s, where prior demand zones sit.
Solana Weekly Heikin Ashi Chart (Logarithmic). Source: TrendSpider/Bitfinex
On the chart, two nearby lows have formed around the current level, raising the question of a possible double-bottom structure. At the same time, the move also fits a broader retracement within the larger cup-shaped formation that spans multiple years. A deeper pullback toward the $79 area remains visible as the next major horizontal support if current levels fail to hold.
The structure shows repeated rejections near descending resistance, while volume expanded during the latest drop, pointing to heavy participation on the selloff. Momentum indicators on the lower panel remain weak, reflecting continued downside pressure rather than a confirmed reversal.

 coinpaper.com