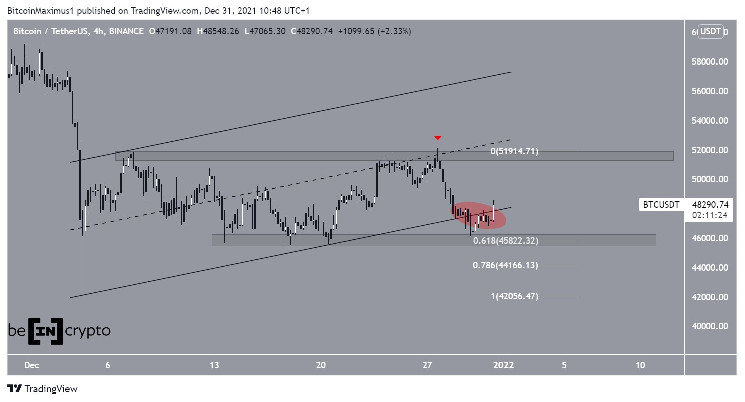
After breaking down from a short-term trading pattern, Bitcoin ($BTC) rebounded at the $48,200 support area.
$BTC had been falling since reaching a local high of $52,088 on Dec 27 (red icon). The downward movement continued until a low of $45,900 was reached on Dec 30.
The decrease seemingly caused a breakdown from the ascending parallel channel it had been trading in. However, the support line of the channel has been reclaimed. Therefore, since the lines of the channel are not being respected, it is likely that $BTC is following a different pattern.
The bounce served to validate the $45,800 area as support. This is the main support area and is both a horizontal support level and the 0.618 Fib retracement support level.
The main resistance area is found at $51,500.

Exchange balance
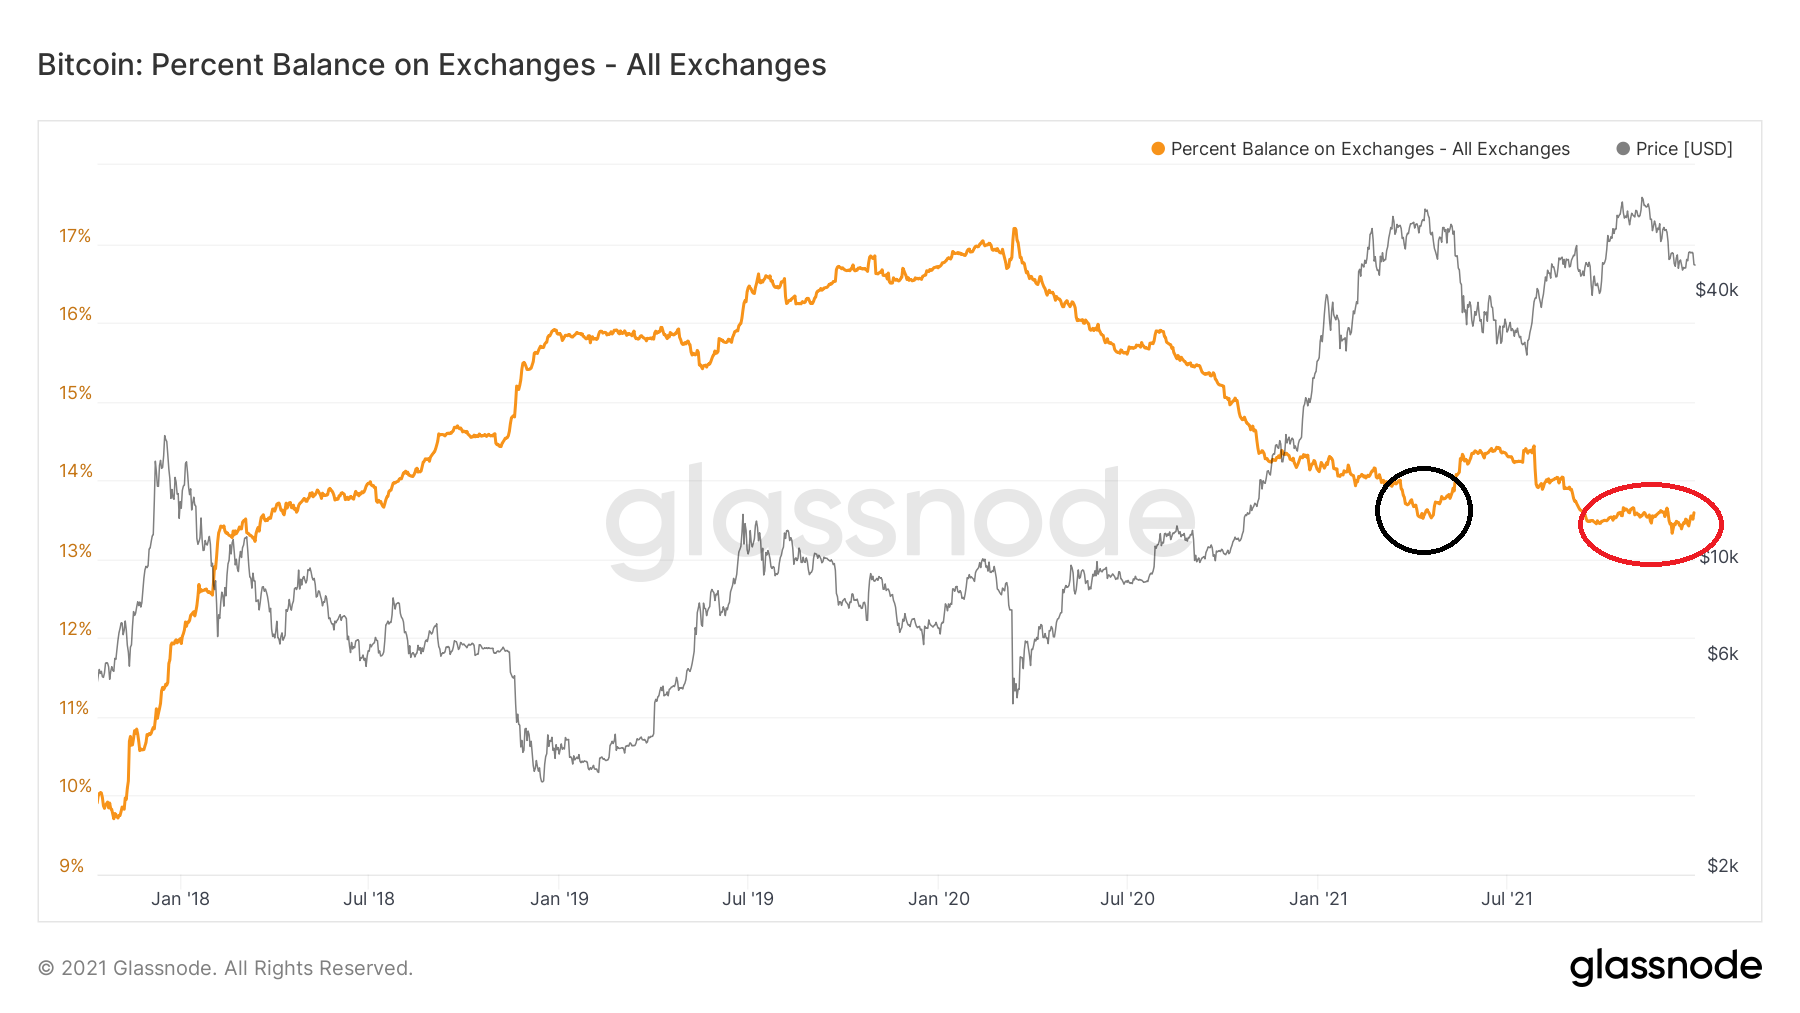
The total $BTC held on exchange addresses has been falling since the beginning of the year. it reached a low of 13.6% on April 14 (black circle), when the $BTC price was close to its all-time high.
Despite bouncing back initially, the indicator continued dropping and reached a new yearly low of 13.4% (red circle). This means that investors are likely storing their coins in cold storage. This is often considered a bullish sign as it shows conviction in the market.

Institutional investment
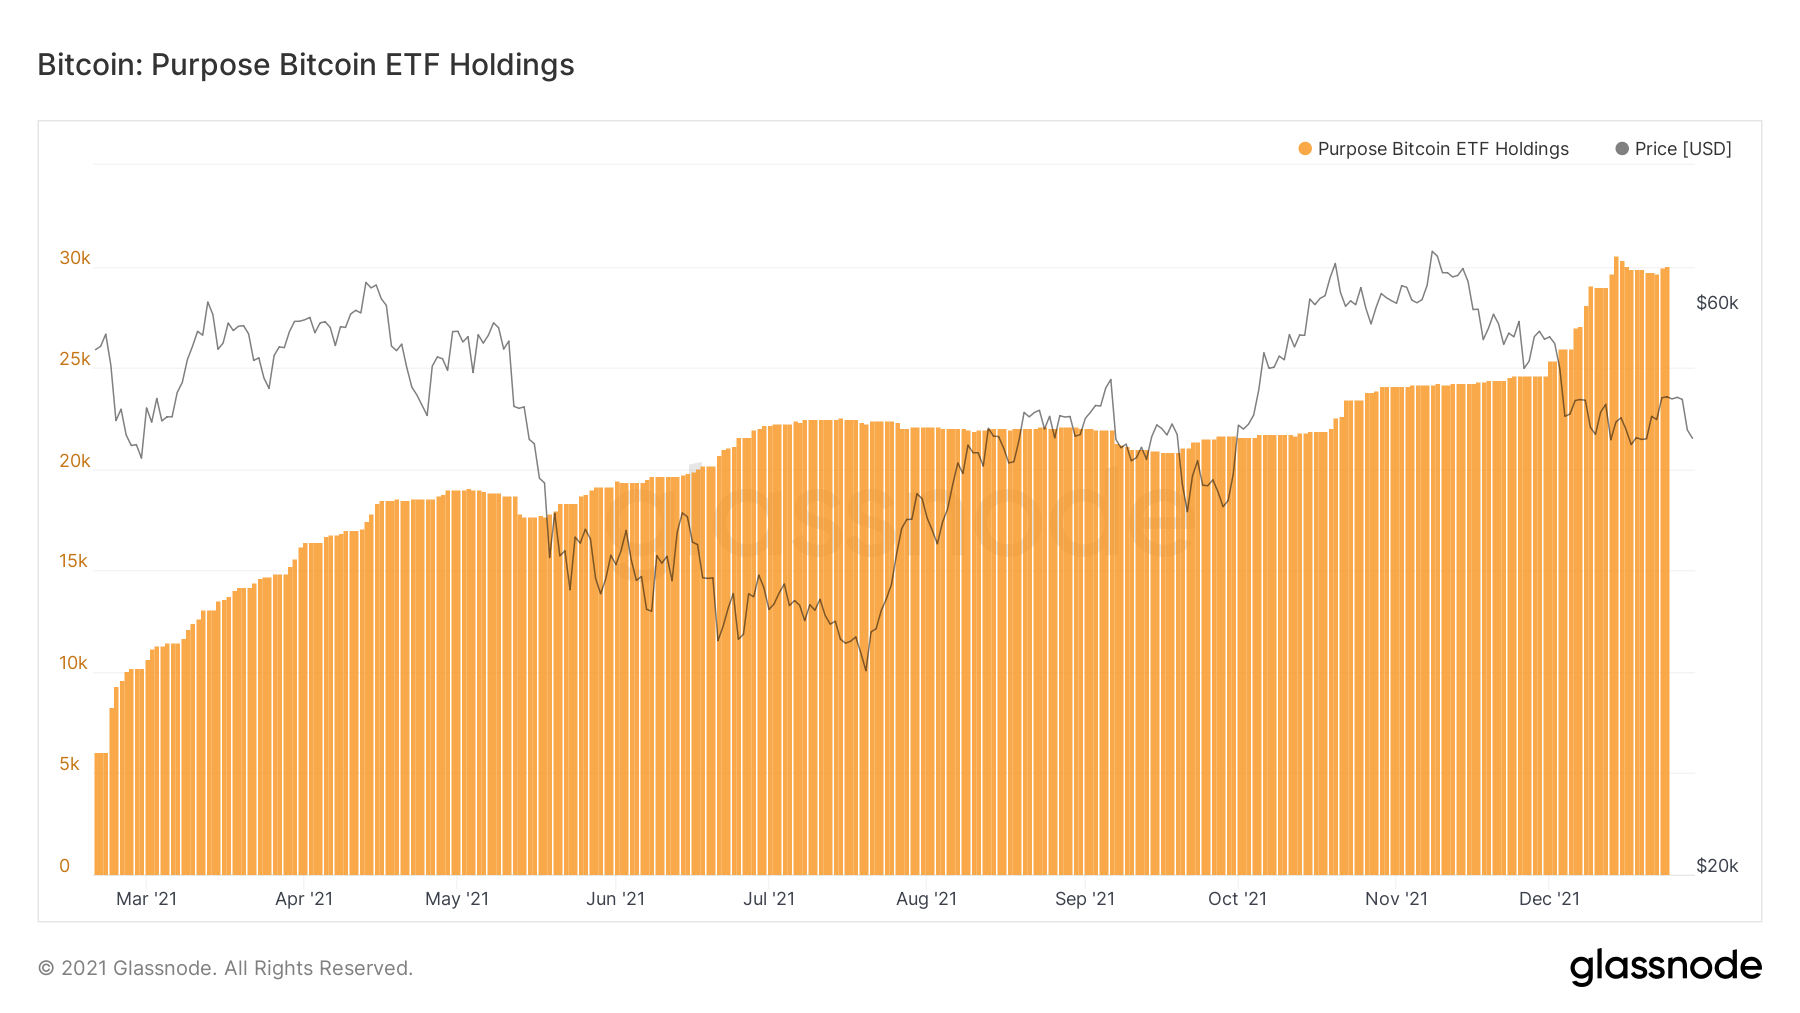
The Purpose Bitcoin ETF holdings have been increasing considerably since the beginning of December. This means that despite the drop in price, institutions are buying the dip, more specifically in prices between $47,000 and $53,000.
The number of $BTC in holdings reached a new all-time high of 30,528 $BTC on Dec 14. Therefore, institutional interest in $BTC is still increasing.

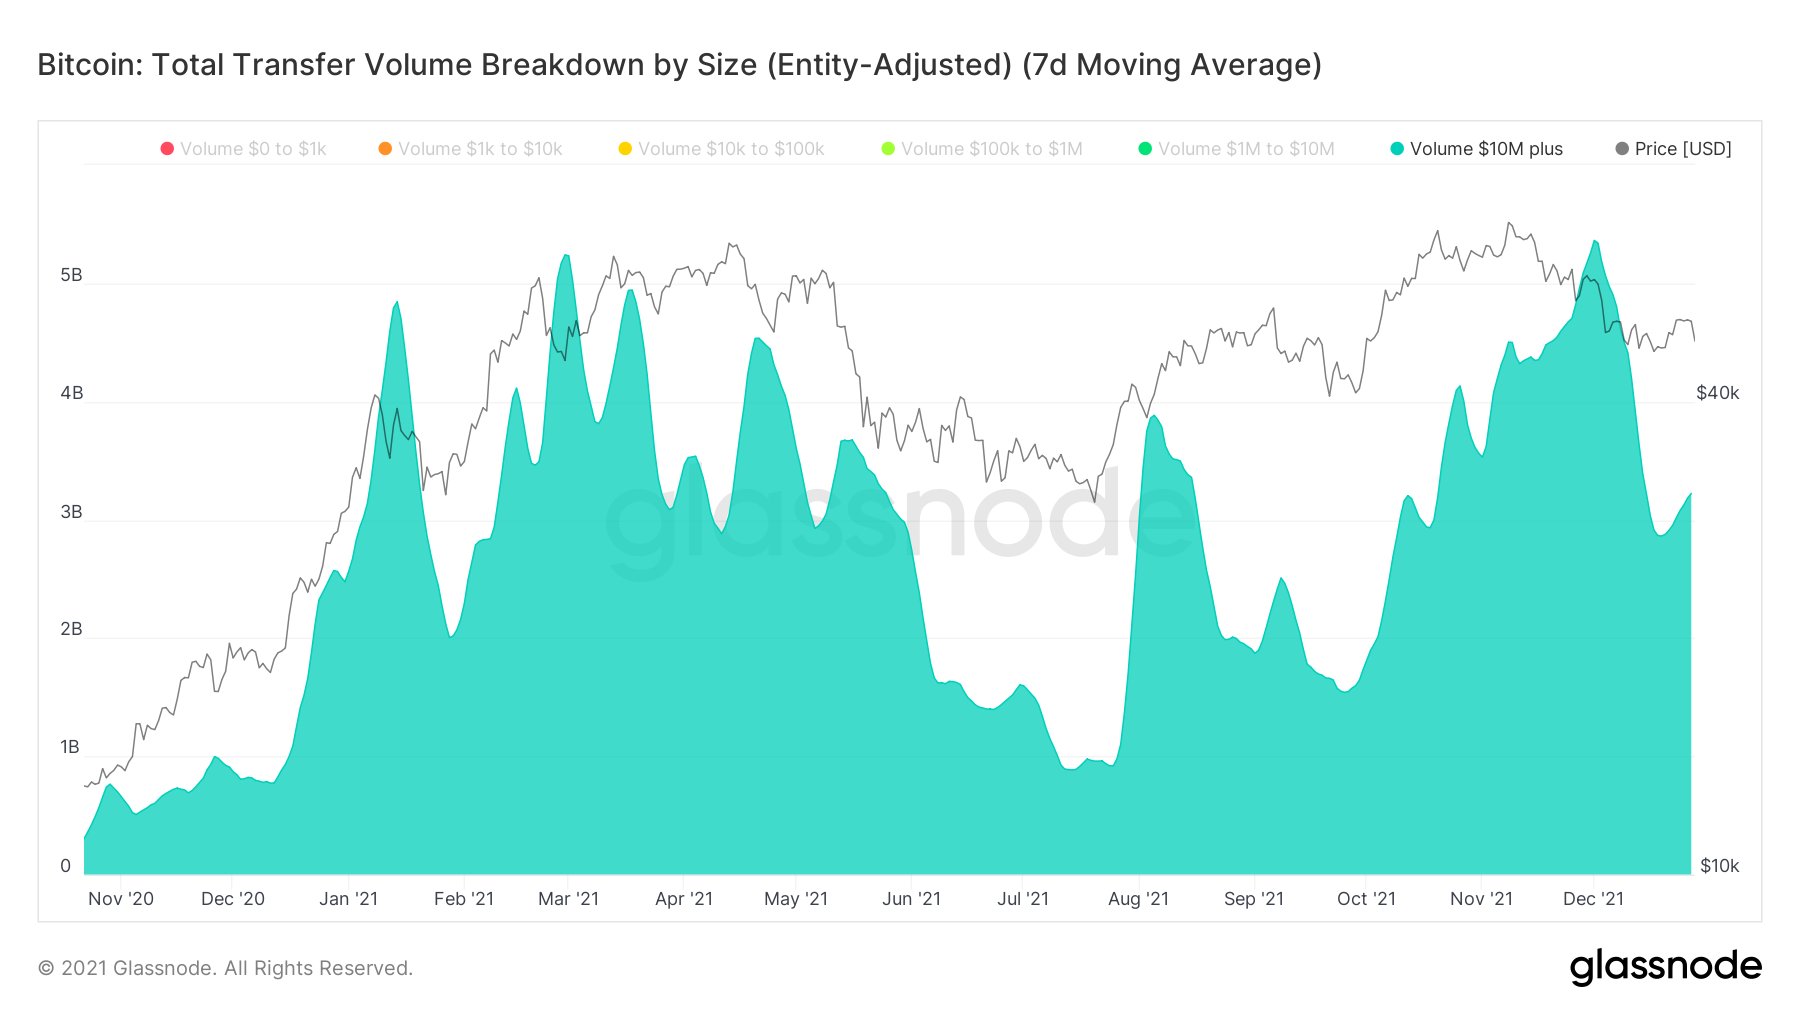
On-chain analyst @Wclementelll tweeted several charts that show institutions have been more active in the market when compared to retail investors. The reason for this is that volume of transfers between $10,000 and $100,000 has fallen, while those over $10,000,000 have increased.
This aligns with the charts from Purpose ETF holdings.

 beincrypto.com