u.today

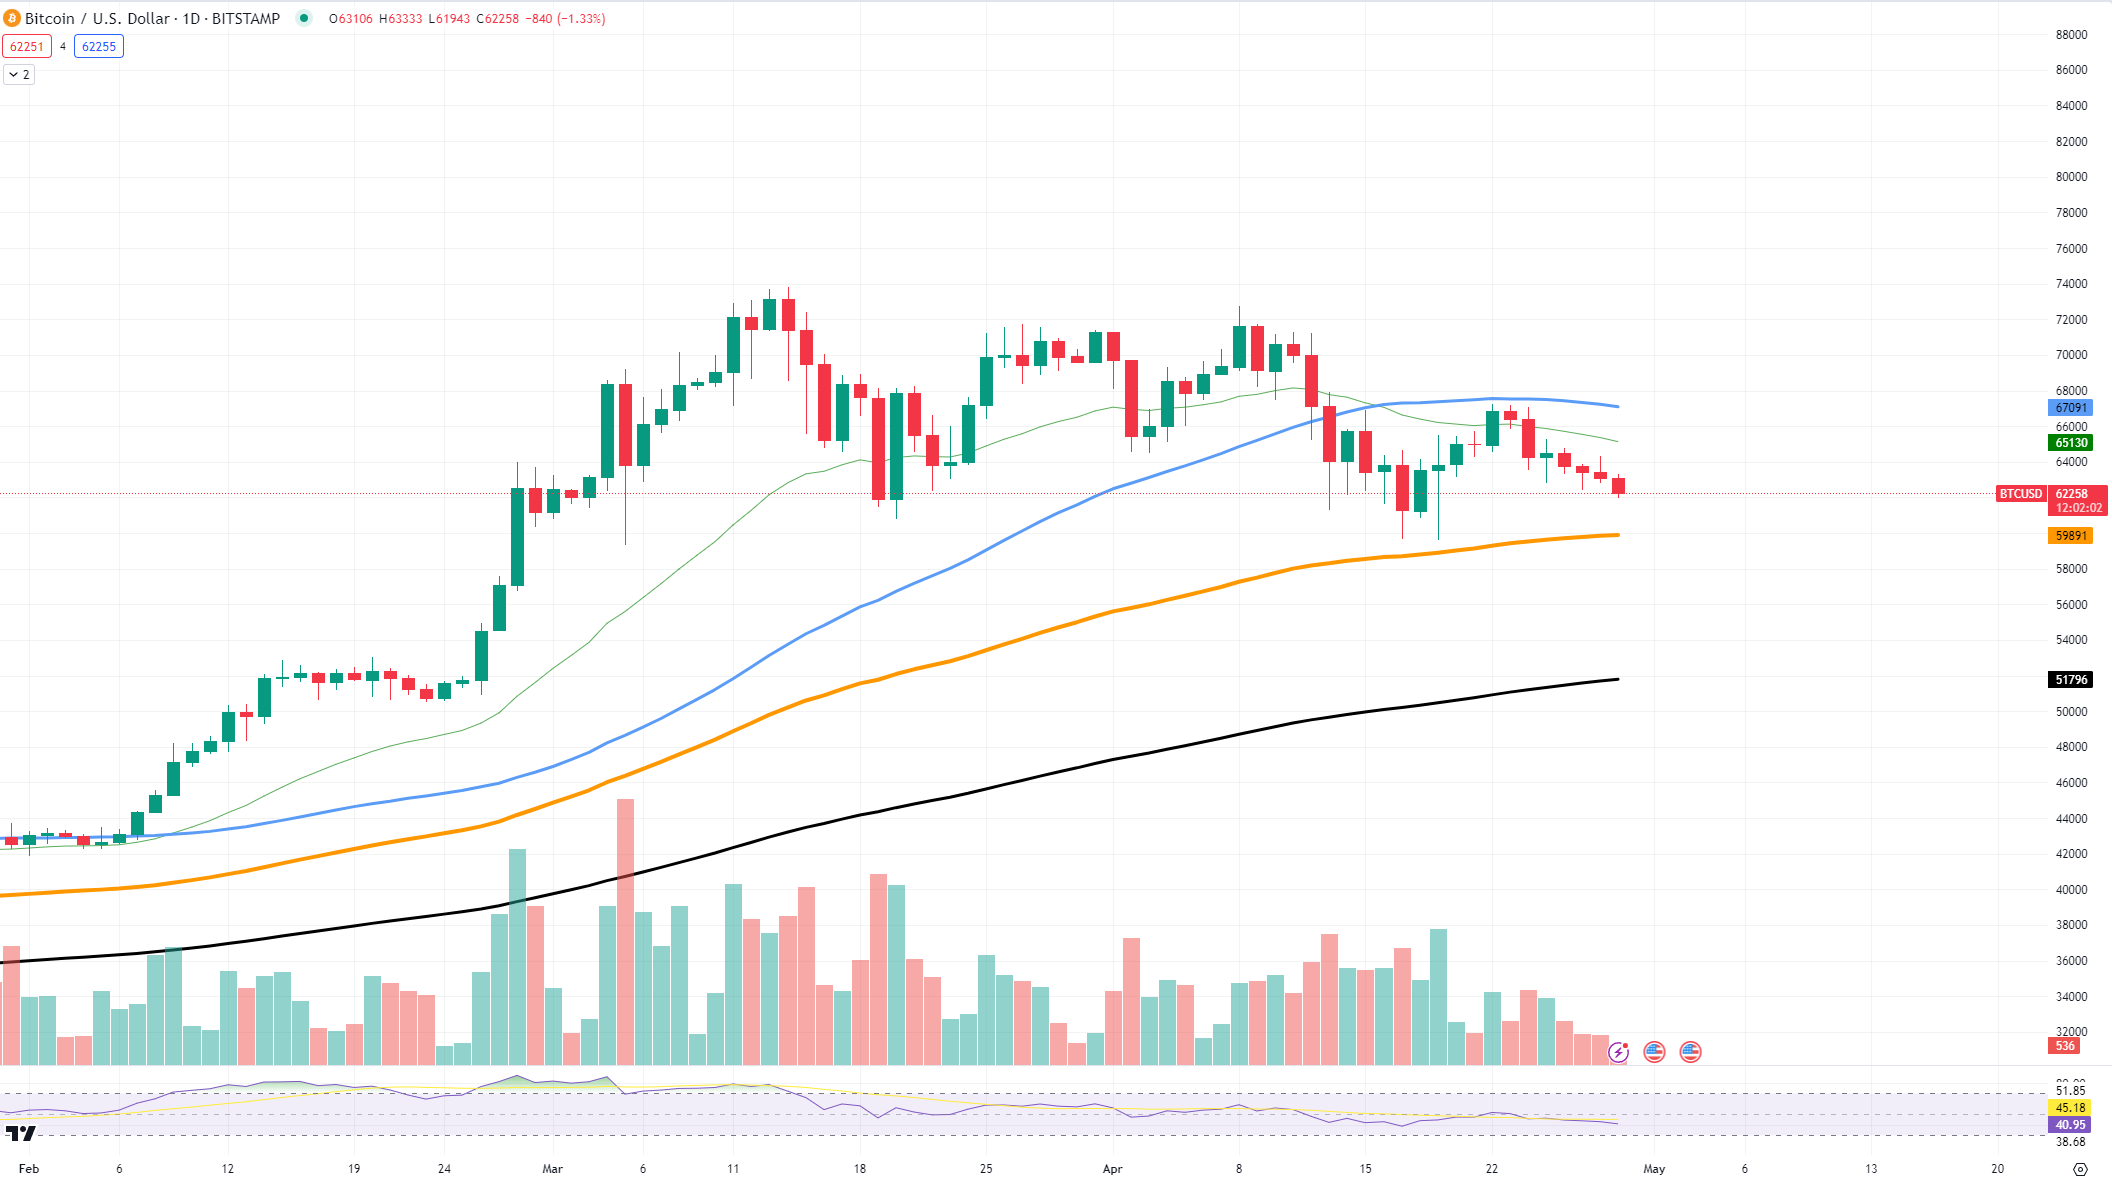
For Bitcoin, the primary obstacle is clear: it is the tight price range that it has been navigating in for some time now. On the daily chart, $BTC has been oscillating between the $60,000 and $70,000 marks, struggling to find a definitive direction. The Relative Strength Index (RSI), situated around the 50% level, implies equilibrium in market momentum.
The pressing question on everyone's mind is whether Bitcoin can maintain its support above $60,000 or if it will drop due to bearish pressure, potentially leading to a fall toward $52,000. While such a drop is within the realm of possibility, analysts consider this a less likely scenario given the current market structure.