Ethereum Price Analysis: Can ETH Hold $1,853 as Weekly Losses Hit 10%?
coinedition.com
27 m
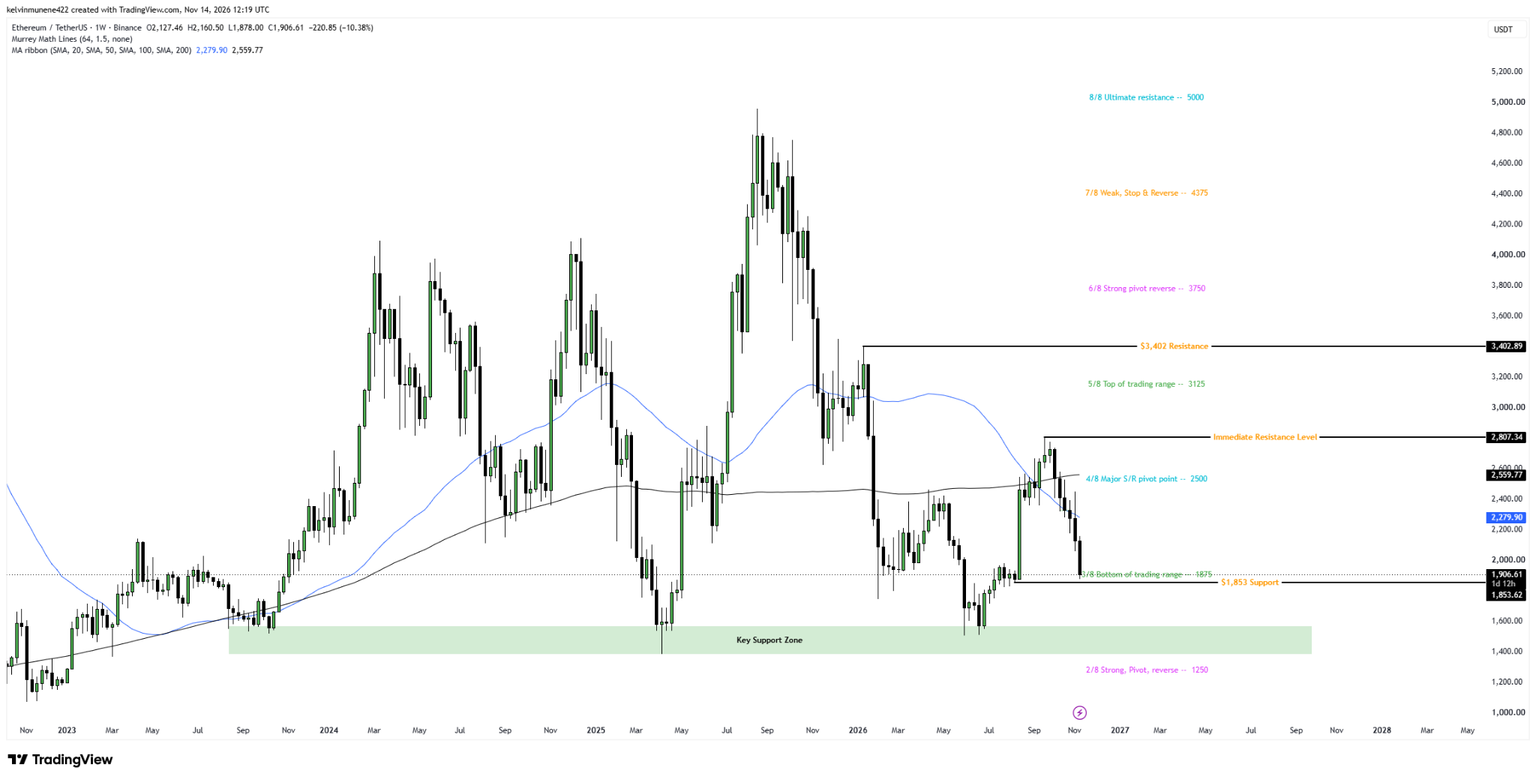
Ethereum ($ETH) was trading at $1,906.61 on November 14, down 10.38% for the week, according to TradingView data. The cryptocurrency had traded as high as $2,160.50 earlier in the week before falling to $1,878.
The losses extend a correction that began after $ETH failed to break above $2,807. Since then, Ethereum has registered a series of lower highs and lower lows on the weekly chart. Attention has now shifted to support just below its current price.
Ethereum Price Risks Further Losses Below $1,853 Support
The first level to watch is $1,875, which marks the lower end of the trading range on the Murrey Math indicator. Another support level sits slightly lower at $1,853.62. If Ethereum closes the week below $1,853 and subsequently fails to reclaim it, selling could extend toward the $1,385–$1,571 region.
Know when your coins move
Alerts, real-time prices, and market news — all in one app
Point your phone camera to install
4.8 based on 40K reviews in the App Store and Google Play
That area has held up against selling pressure on previous occasions. $ETH recovered from this zone in 2025 and eventually traded above $4,800. Buyers returned to the same region in 2026, driving a recovery toward $2,807.
Source: TradingView
Ethereum has, however, lost roughly 60% of its value from the $4,800 region. Below the historical support zone, the Murrey Math indicator places another potential reversal level at $1,250.
Ethereum Trades Below Key Moving Averages as Momentum Weakens
The weekly chart also shows $ETH trading below its 50-week and 200-week simple moving averages at $2,279.90 and $2,559.77. The lower average continues to slope downward. Should Ethereum recover, the first of these averages could present resistance.
Further up, the $2,500 Murrey Math pivot sits close to the second moving average near $2,560. There is also resistance at $2,807.34, where the previous recovery stalled. A break above that level could bring $3,125 into play, with another horizontal resistance level at $3,402.89.
Follow us onXfor real-time crypto updates.
Ethereum Price Outlook Depends on Weekly Support Retention
For now, $ETH remains above the $1,853–$1,875 support region. Buyers defending this area could see the cryptocurrency consolidate or attempt a recovery toward $2,279. Trading below $1,853 for an extended period, however, could leave $ETH exposed to a deeper correction. The weekly candle was still open at the time of the analysis, meaning a breakdown had yet to receive confirmation.
Ethereum Price Resistance Levels
Resistance Level
Significance
$2,279.90
Weekly moving average
$2,500–$2,559.77
Pivot and moving average resistance
$2,807.34
Previous rejection level
$3,125–$3,402.89
Higher resistance levels
Bullish Case
If buyers hold $1,853, $ETH could work its way back toward $2,279 and later test $2,500.
Bearish Case
However, a weekly close below $1,853 could bring the $1,385–$1,571 demand zone into focus.
Neutral Case
Meanwhile, $ETH could spend more time trading around $1,853–$1,875 without establishing a clear direction.
Ethereum Price FAQs
1. Why Is Ethereum Price Falling?
Selling pressure continues to weigh on $ETH, while its weekly market structure remains bearish.
2. What Is Ethereum’s Critical Support Level?
The immediate horizontal support sits at $1,853.62.
3. Can Ethereum Fall Below $1,500?
That remains possible if $ETH breaks below $1,853 and fails to recover.
4. What Could Strengthen Ethereum’s Bullish Outlook?
A recovery above the weekly moving average of $2,279.90 could improve the technical outlook.
Subscribe to our YouTube channel for the latest crypto news.
Related: XRP 6-Week Bearish Sentiment Revisits 2026 Extremes: Will Price Fall Further?

 coinedition.com