On Wednesday, bitcoin’s trade volume and overall value provided insights into its current technical situation. With a daily trading volume reaching $45.30 billion and a total market value of $1.29 trillion, the cryptocurrency’s liquidity and market breadth still stands strong. However, recent downturns have left traders wary. Currently, bitcoin has declined by 6% this week in comparison to the U.S. dollar.
Bitcoin
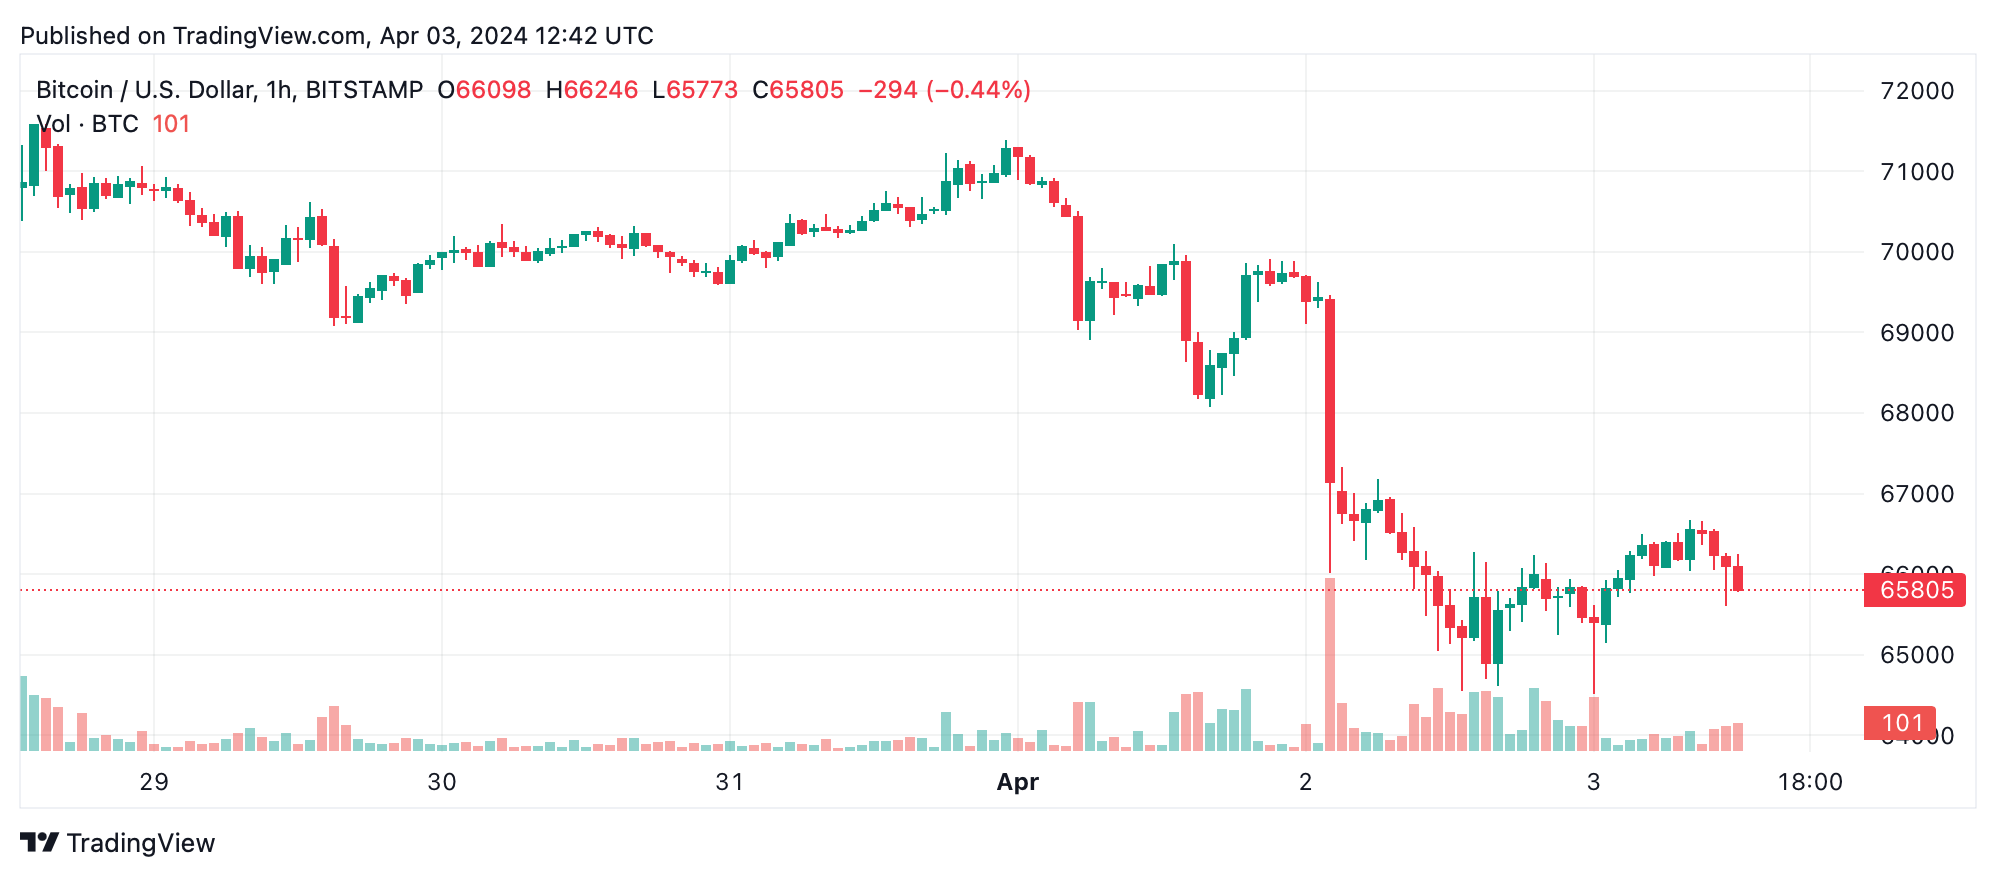
On the 1-hour chart, bitcoin’s (BTC) price trajectory shows a consistent downward trend, signaling a bearish outlook in the immediate term. The market’s moderate volatility within this timeframe suggests some resilience against larger sell-offs, yet the presence of established support at $64,511 and resistance at $69,464 delineates a constrained trading range. This bearish tilt is further corroborated by the 4-hour chart, where a pronounced downtrend is marked by significant bearish drops, pointing towards a consolidation phase with potential downside risk.

The 4-hour overview reveals a continuation of the bearish sentiment, highlighted by increased volatility and more substantial price movements. Despite this, the reaffirmed support level at $64,511 and a new resistance point at $71,391 suggest a wider band for potential price action. However, the mid-term analysis also indicates a market in search of direction, as evidenced by the oscillators—most of which hover in neutral territory, though with a slight inclination towards sell signals.

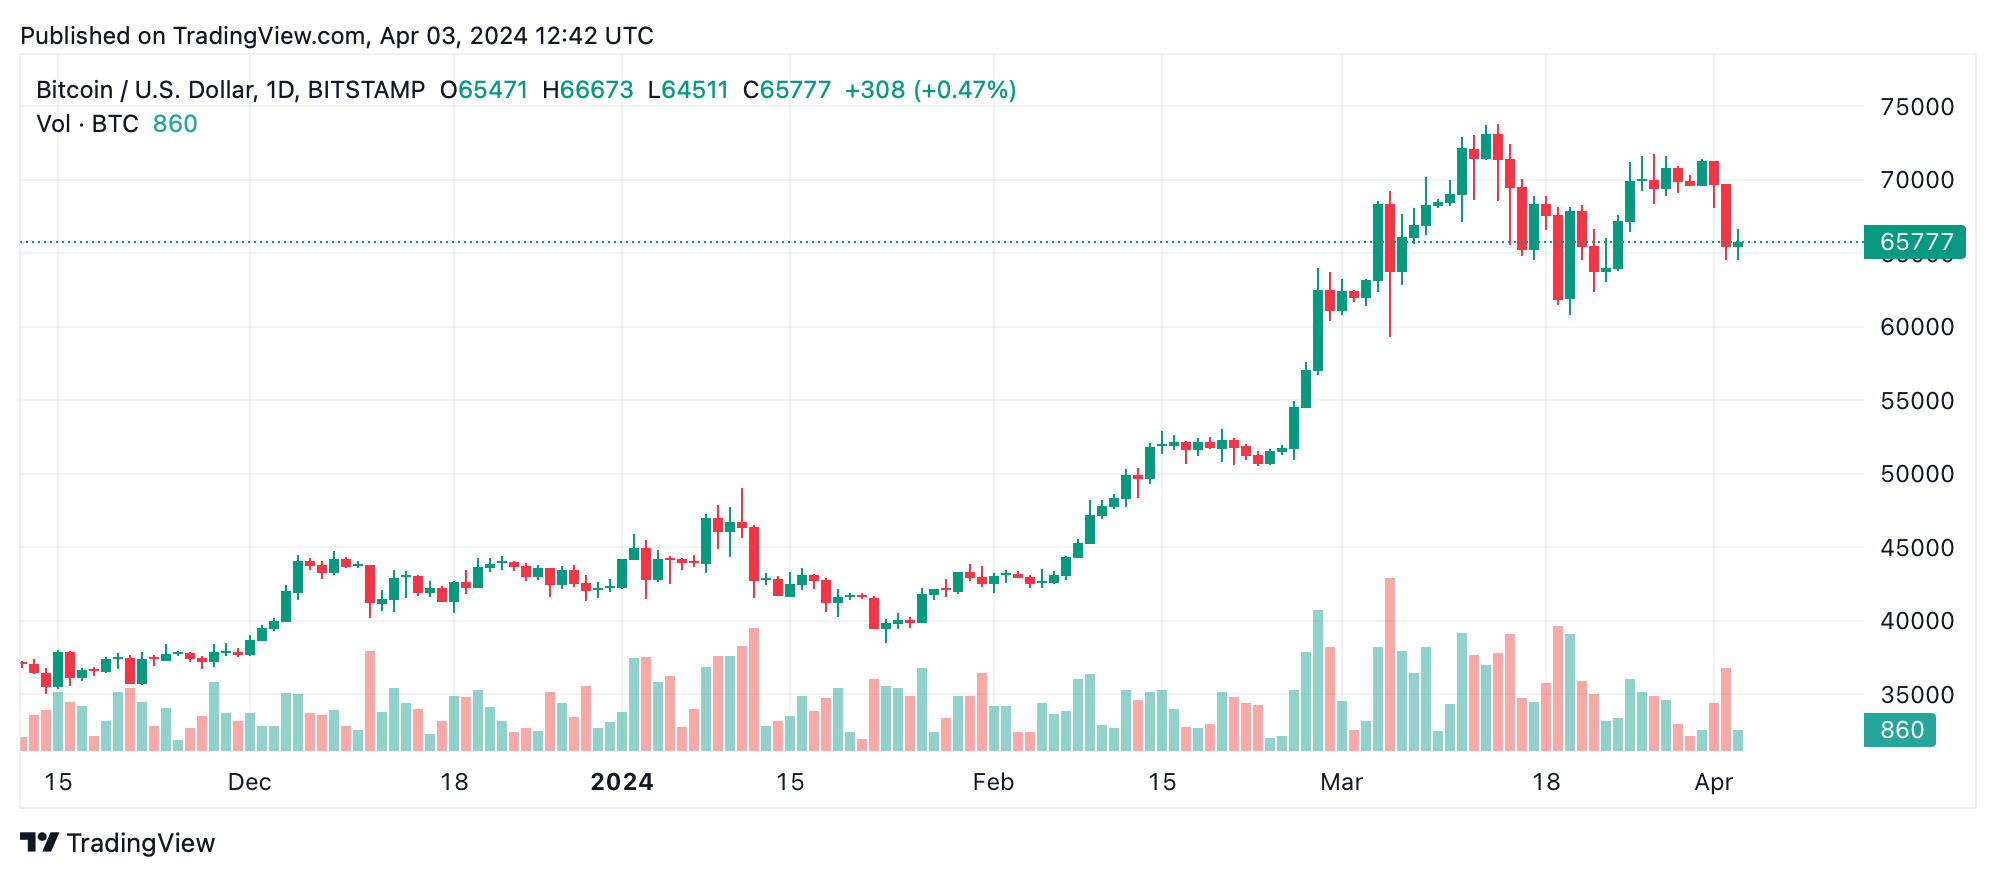
On the daily chart, bitcoin presents a complex picture of alternating bullish and bearish patterns, hinting at a broader phase of consolidation. Significant volatility, as marked by extensive price swings, underscores the uncertainty prevailing in the market. Yet, the appearance of the last significant drop suggests a bearish undertone. Support at $59,313 and resistance at $73,794 mark the boundaries of this longer-term phase, offering a glimpse into the critical levels that could define bitcoin’s path forward.
The aggregate view from oscillators and moving averages paints a narrative of caution. While the relative strength index (RSI), Stochastic, and other oscillators largely signal neutrality, the preponderance of bearish indications among moving averages—especially in the short to mid-term ranges—hints at underlying negative pressure. Notably, longer-term moving averages suggest a potential for reversal, with positive signals emerging in the 50, 100, and 200-day metrics, reflecting a contrast to the more immediate bearish indicators.
Bull Verdict:
Despite the immediate bearish signals, Bitcoin’s technical analysis reveals underlying strengths that could pave the way for a bullish reversal. The emergence of “buy” signals in the longer-term moving averages, especially from the 50-day moving average onwards, indicates a potential for foundational support and upward momentum.
Bear Verdict:
The bearish undertones evident in Bitcoin’s short to mid-term technical indicators cannot be overlooked. The predominance of “sell” signals among both oscillators and moving averages in these time frames paints a cautious picture. Moreover, the established resistance levels and the presence of significant bearish candlesticks on the charts suggest that downward pressure may persist. The neutral stance of most oscillators further indicates a lack of strong momentum, potentially leading to further consolidation or a downtrend.
 news.bitcoin.com