Such a sudden rise caused many to wonder if the cryptocurrency can continue climbing to the halving itself – an event that historically saw massive increases in Bitcoin’s price – or if a correction, perhaps to as low as $36,000, is inbound.
Why? On the morning of Thursday, February 15, a renowned crypto expert warned on X that a reliable technical indicator signaled a strong sell signal on $BTC’s daily chart.
Technical analysis reveals Bitcoin bound for a correction
On February 15, the prominent cryptocurrency analyst Ali Martinez took to X to alert the community that a technical analysis (TA) tool called the TD Sequential is signaling that the price of Bitcoin might soon start falling.
In the same post, the expert highlighted that the indicator has, since December 2023, proved reliable when issuing buy or sell signals for the world’s foremost cryptocurrency.

$BTC price analysis
Given the numerous factors driving Bitcoin’s price, it remains possible that it will continue surging to the halving itself and beyond and that it will crash beforehand. What is not only possible but certain is that the cryptocurrency has seen a significant rally of late.
Having risen 2.09% in the last 24 hours of trading, Bitcoin stands at $52,296. Generally, its rise in the last week has been strong at 16.64% and has been equally significant in the last 30 days at 23.14%.
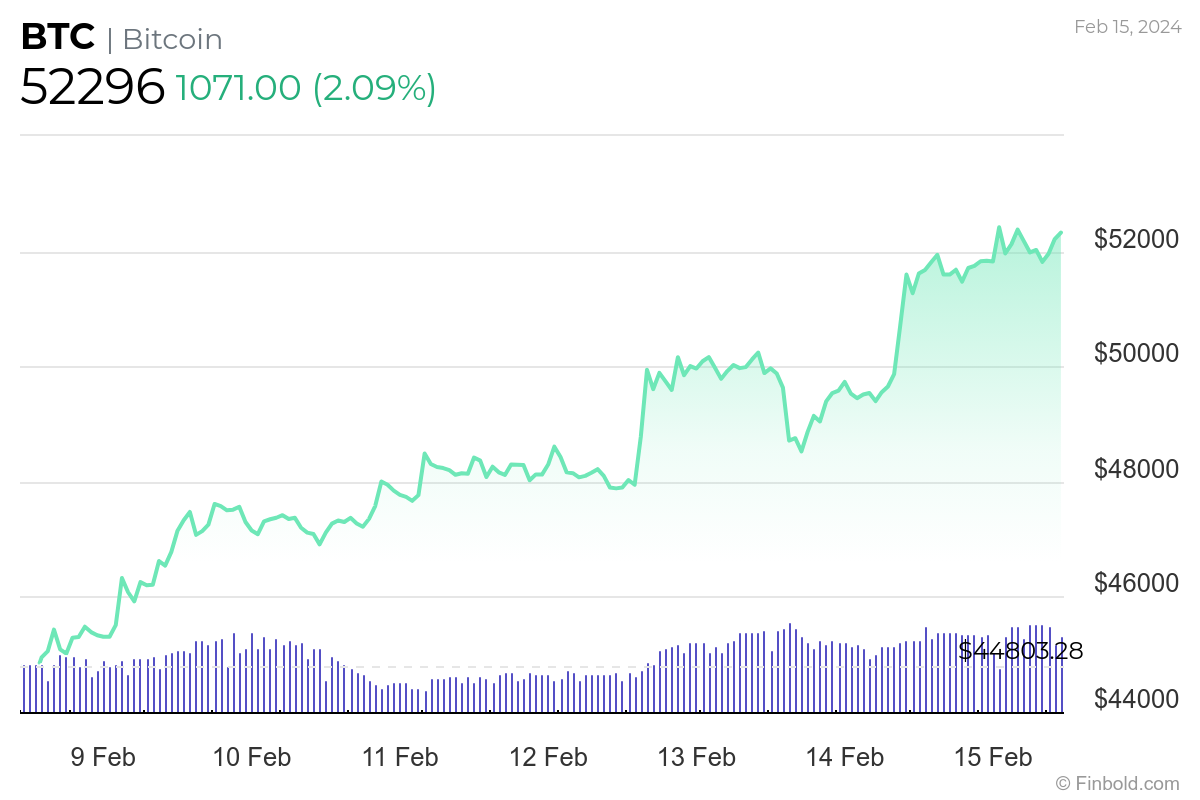
The world’s foremost cryptocurrency has also been surging since January 1 and is 18.45% in the green for the period – though its rise was staggered in the immediate aftermath of the ETF approvals – and it is up as much as 115.05% in the last 52 weeks. $BTC reclaimed a market cap of over $1 trillion on Valentine’s Day.
Disclaimer: The content on this site should not be considered investment advice. Investing is speculative. When investing, your capital is at risk.

 finbold.com




