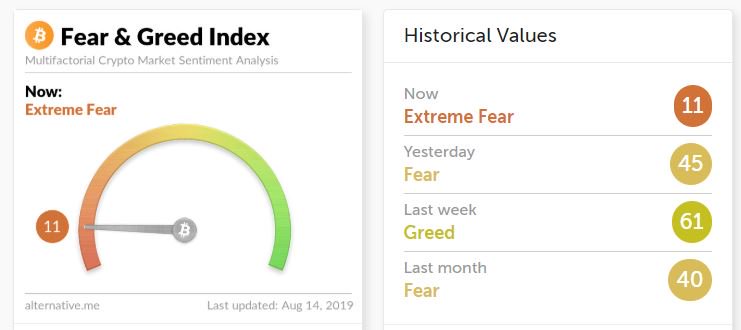
By CCN Markets: The Bitcoin Fear and Greed Index has crashed to its lowest level in almost a year. The index, which tracks sentiment among investors, hasn't plumbed these lows since December 2018 when the king of crypto finally found yearly support just above $3,000.
The current reading of 11 out of a possible 100 registers as ‘Extreme Fear’ on the scale. However, a contrarian reading of that chart suggests that a buying opportunity may be just around the corner.
Bitcoin Fear & Greed Index Doesn't Scare the Pros
Global macroeconomist and trader, Alex Krüger, clearly isn't afraid of the current selling pressure. He was quick to point out that buyers would likely prop up the price in the $10,300 support zone.
Are you afraid?
I am not.
(Fear & Greed index currently at the Dec/2018 lows)
Next key level below at $10300-10325. $BTC pic.twitter.com/Fm5KdhU6N4
— Alex Krüger (@krugermacro) August 14, 2019
Responding to a follower's tweet who questioned the timeliness of the index data, Krüger opined:
“I don't like the index's construction much, but it has been relatively accurate at pinpointing bottoms or nearabouts on the daily.”
CCN reached out to Krüger for further comment about his response. He informed us that while the index has some merit, it's not an ideal trading tool - at least not in isolation.
“I don't trade off of it but it sometimes lines up with the chart nicely and with traders on social media and private chats going dead silent.”
How Accurate Is This Particular Index?
Now for the real question: What, if anything, does this "Extreme Fear" reading mean for investors?
The answer, like all things in trading, is "it depends." The index uses a number of metrics to determine its values, including Google Trends data, volatility, surveys, and, of course, social media.
Social sentiment is a particularly challenging field to measure, and researchers are only starting to come to grips with accurate measurement tools.
If we superimpose a chart of the Bitcoin price over the Fear & Greed Index, we get a fascinating picture of the market tops and bottoms.
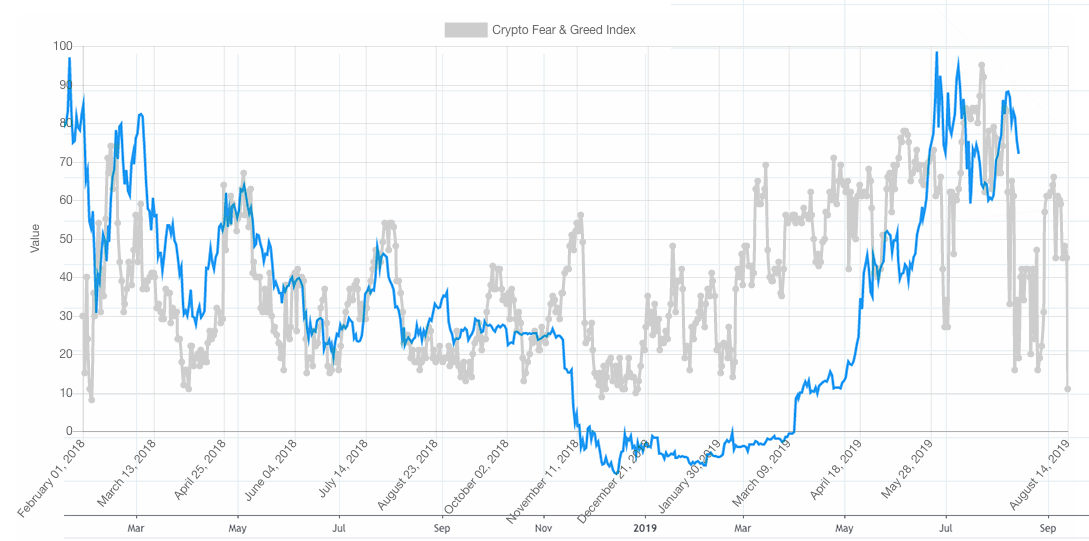
As you can see, extreme readings do often correlate with turning points. They tell you nothing about timeframes though. Consequently, it could be more useful for short-term traders given how young the index is. That's all up for debate, of course.
Sentiment indices for altcoins will also soon be available. Traders may, however, might want to stick with the headline act. As CCN recently reported, Bitcoin's brutal dominance shows no signs of slowing down.
Is this an interim bottom for Bitcoin? Your guess is as good as anyone else's.
Click here for a real-time Bitcoin price chart.
This article is protected by copyright laws and is owned by CCN Markets.