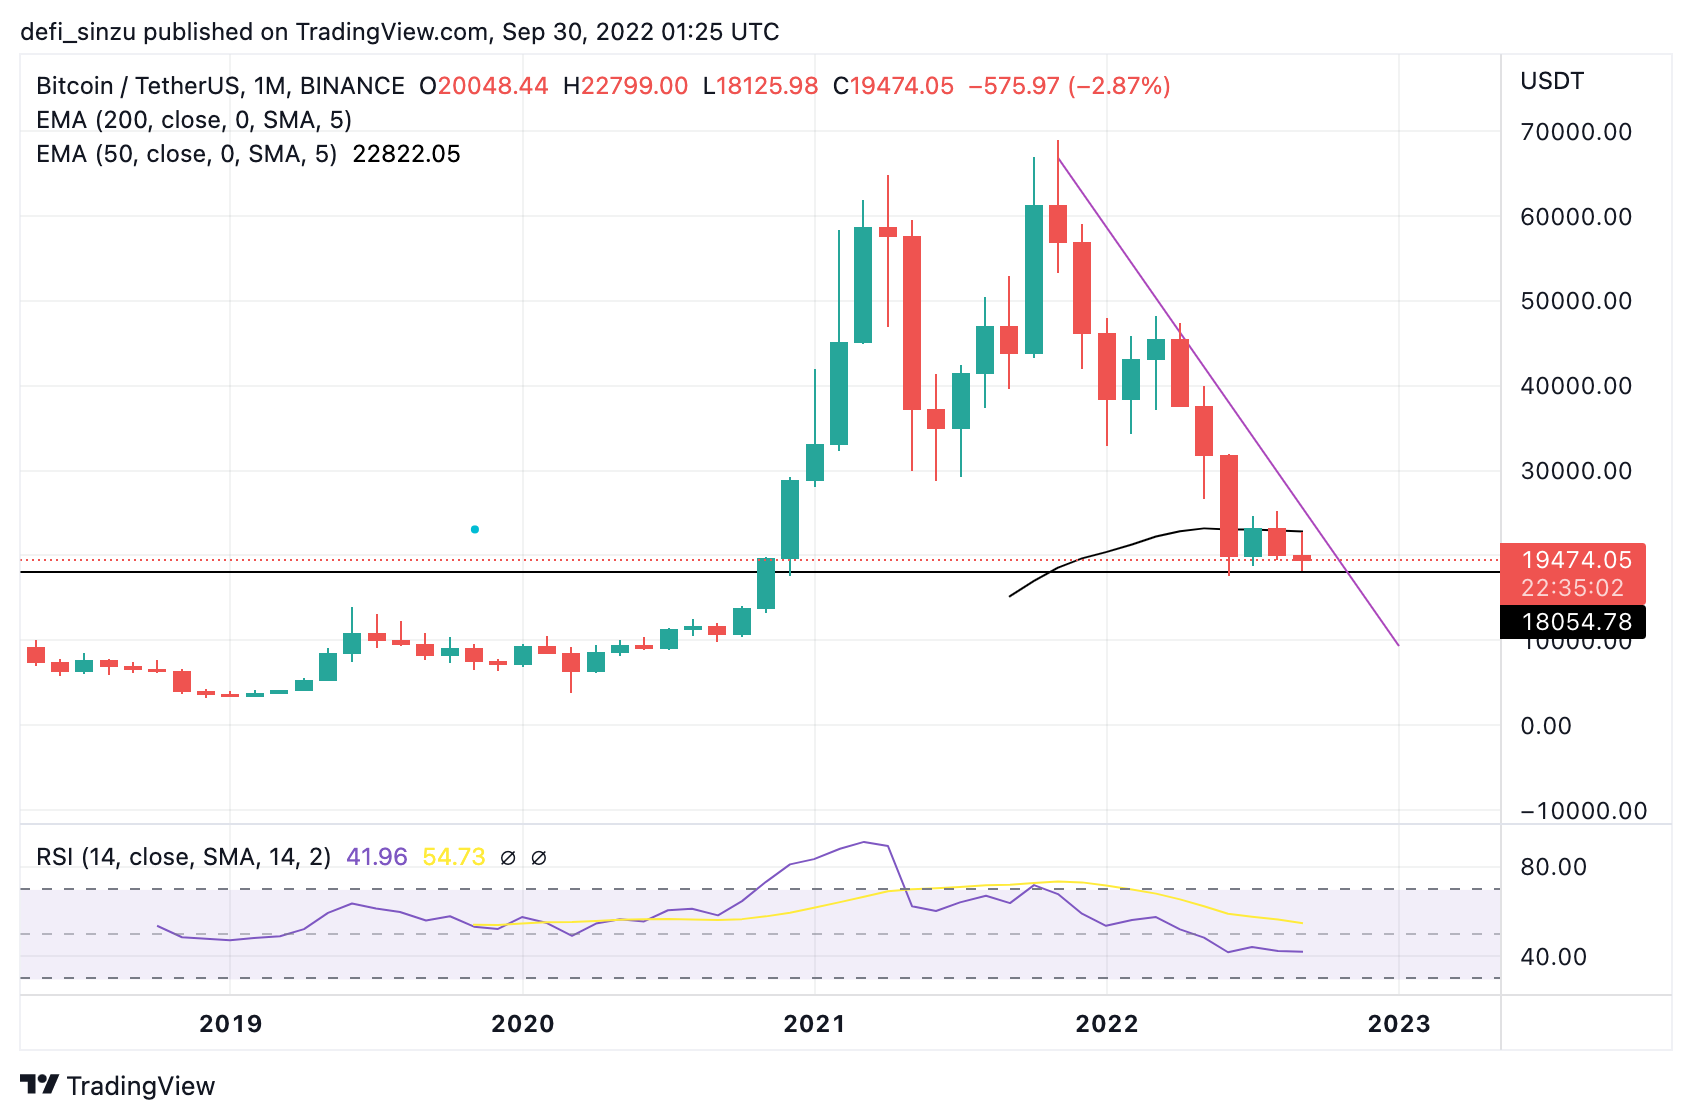
On the monthly chart, the price of $BTC has seen more downside than upside, falling from a region of $69,500 to a current value of $19,450, where the price is struggling to close the month on a positive note.
$BTC’s price needs to close above $21,500 to begin a small relief rally, as it has continued to trade at its previous all-time high and has tested the region numerous times, with the area acting as support looking weaker with each retest.
$BTC must break and hold above the $21,500 resistance with good volume in order to restore a relief bounce. If the price of $BTC remains in this current structure and refuses to break higher, we could see it retest $17,500 support and possibly a lower support area of $17,000 on the Monthly chart if there is a sell-off.
Monthly resistance for the price of $BTC – $21,500.
Monthly support for the price of $BTC – $18,000.
Price Analysis Of $BTC On The Daily (1D) Chart
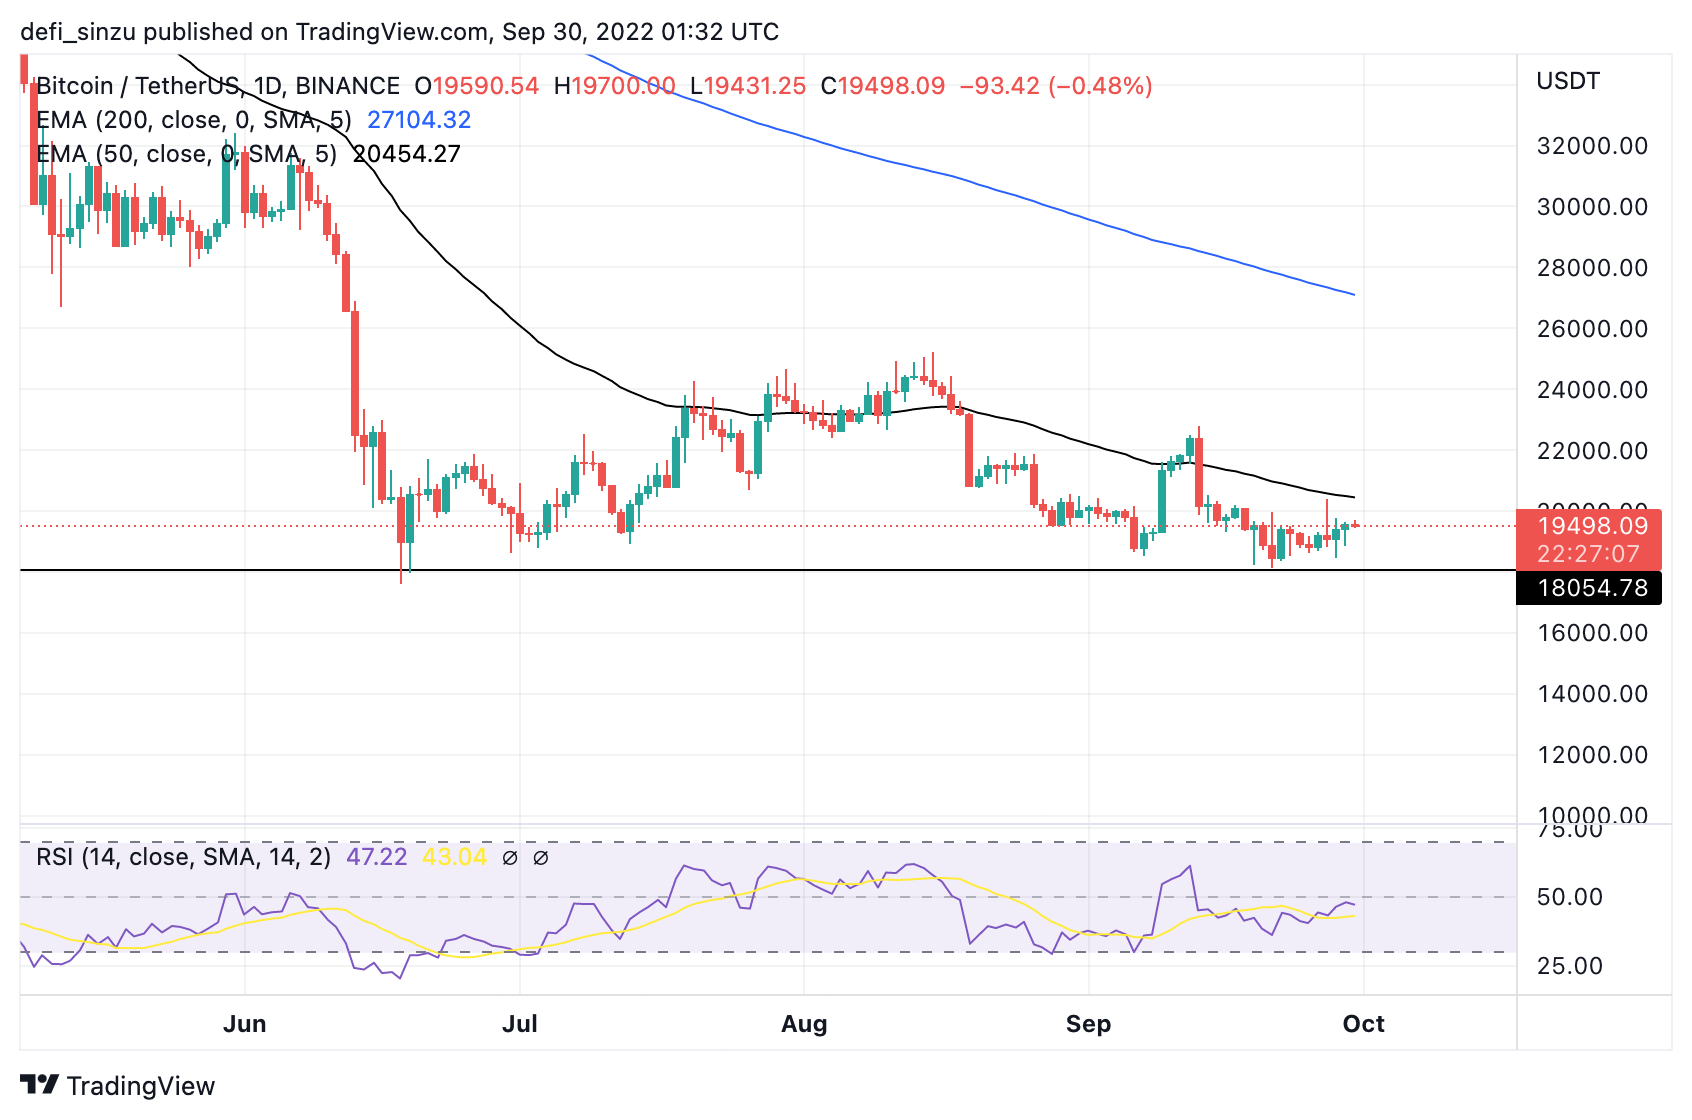
In the daily timeframe, the price of $BTC continues to trade below key resistance as the price remains in a range to break above to higher heights.
The price of $BTC on the daily chart showed strength to break out above $20,500 as the price faces rejection in an attempt to break out of its range-bound movement.
The price of $BTC trades at $19,460 below the 50 and 200 Exponential Moving Average (EMA). The prices of $20,500 and $28,000 correspond to the prices at 50 and 200 EMA for $BTC on the daily timeframe.
$BTC needs to break and close above $20,500 for the price to gain momentum as the current price action hasn’t been favorable for $BTC’s price.
Daily resistance for the $BTC price – $20,500.
Daily support for the $BTC price – $18,000.
Featured Image From Dictionary, Charts From Tradingview

 newsbtc.com