The cryptocurrency market that had seen major gains in the last week of 2018, has fallen prey to the bear’s chase and is bleeding. Tron [TRX], the only coin that has previously resisted the bear is also wounded in the bear’s attack. It had noted growth of over 20% in the past day but this changed as the bear struck. It took down the eighth largest coin by more than 10% in an hour. However, at the time of press, the coin seems to be recovering.
According to CoinMarketCap, the coin was valued at $0.0296 with a market cap of $1.9 billion. The coin registered a 24-hour trade volume of $696 million and notes a fall by 4.09% over the past hour. The coin reflects the growth of 9.20% over the past 24 hours, with over a week’s growth recorded to be 48.14%.
1-hour
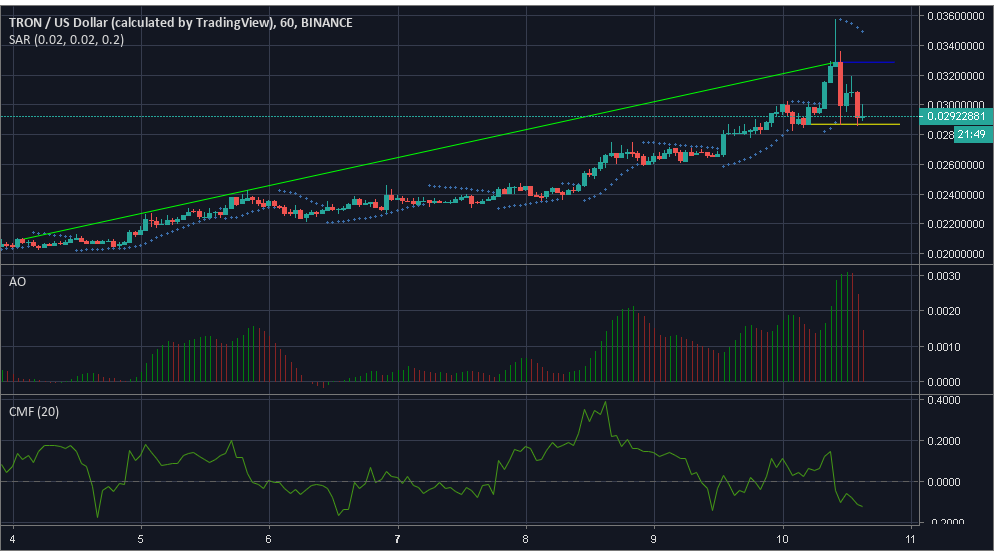
Source: Trading View
The one hour chart of the coin reflects a massive growth from $0.0209 to $0.0328, after which the coin fell to $0.0299. The coin started a recovery immediately. The coin has marked resistance at $0.0328 while support seems strong at $0.0287.
Parabolic SAR indicates a bearish market as the markers aligned themselves above the candles.
Awesome Oscillator too points towards a bearish market losing momentum.
Chaikin Money Flow indicates a bearish market as the marker is under zero.
1-day
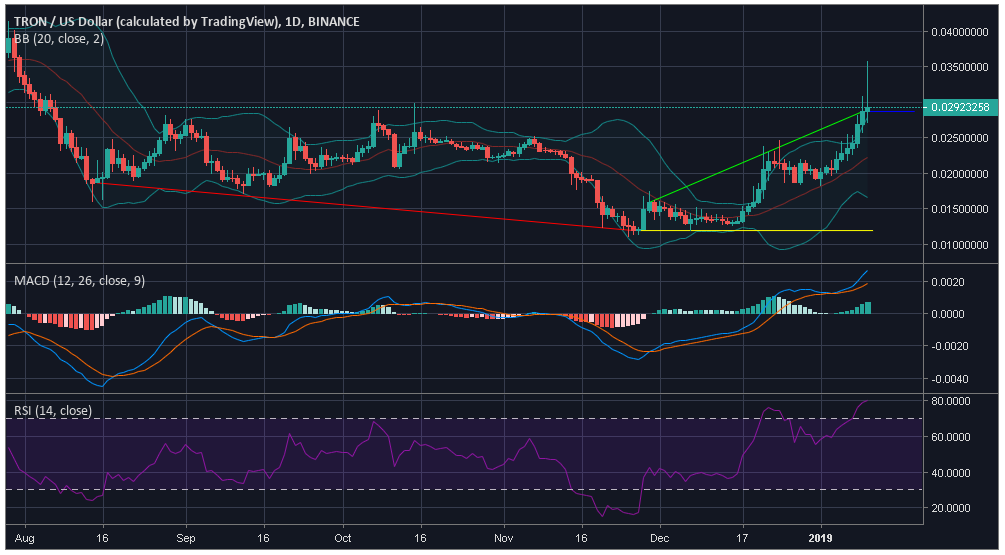
Source: Trading View
As per the one day chart of the coin, a downtrend was noted from $0.0186 to $0.0119, after which it started to hike from $0.0158 to $0.0287. The coin has not marked a new resistance at the time of press, as it has broken its earlier resistance at $0.0287. The coin marked strong support at $0.0119.
Bollinger Bands is at a converging point but is slowly seen to diverge, increasing the volatility in the market. The moving average line is observed to be under the candlestick marking a bullish trend.
MACD line is over the signal line pointing towards a bullish market.
Relative Strength Index is in the overbought zone.
Conclusion
As per the indicators, Parabolic SAR, Awesome Oscillator, and Chaikin Money Flow the market is bearish from the bear’s attack on December 10 but is slowly recovering. The indicators Bollinger bands and MACD forecast that a bullish trend might be underway.