About 341.3 billion $SHIB left exchanges over the same period. Exchange reserves increased by 0.18% to about 85.89 trillion $SHIB. The dollar value of those reserves fell by 5.21% to around $316.9 million. Gross inflows were up 2.21% in the table’s 24-hour comparison, while net inflows were up 5.87%. The ten largest deposits accounted for about 10.86 billion $SHIB.
The seven-day moving average of mean inflow rose by 86.2%, pointing to a substantial increase in the average deposit size. The moving average reached about 1.72 billion $SHIB per deposit. The latest unsmoothed mean inflow was roughly 2.76 billion $SHIB per deposit.
Shiba Inu price outlook
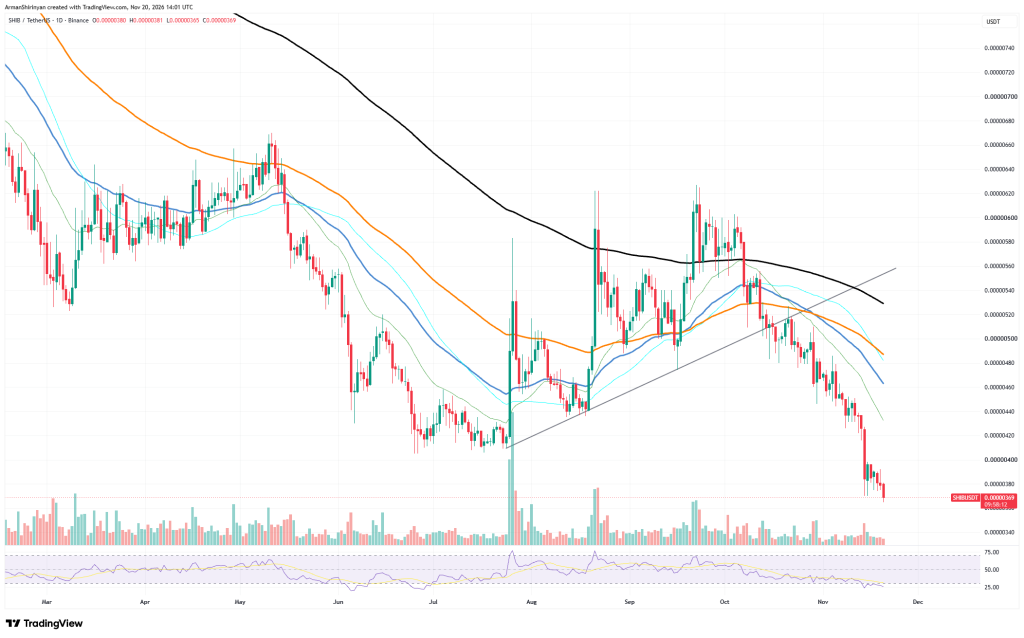
From a price perspective, the $SHIB chart shows a clearly bearish pattern, with the downtrend continuing rather than a recovery taking shape. Falling trading volume alongside the price could suggest that selling pressure is easing, but it should not be seen as a sign of a reversal.
$SHIB was trading at $0.00000370 on the Binance daily chart on November 20. The session low at the time of the snapshot was $0.00000365. The asset was below all the moving averages shown on the chart, and the RSI was near the oversold area. The brief bounce after the latest drop also stayed below $0.000004.
For $SHIB to make a lasting recovery, it needs to break above the $0.000004 price level. Price moves below this level are unlikely to provide a solid base for recovery.

 u.today