PEPE Price Tops Daily Losers as Meme Coins Bleed 25%
crypto-news-flash.com
27 m
$PEPE recorded the steepest daily loss among the 100 largest cryptocurrencies.
The sell-off hit the one major meme coin that had kept rising into November.
Bitcoin ETF outflows and shrinking stablecoin supply are draining demand for speculative tokens.
Buyers now face a test in the same zone where they absorbed a large exploit-wallet sale in October.
$PEPE fell 11.22% over the past 24 hours to around $0.0000044 on Thursday. That made it the worst performer among the 100 largest cryptocurrencies on CoinMarketCap and cut its market value to $1.82 billion. $PEPE had been the only major meme coin still holding a rally into November, and its reversal leaves the sector without a clear leader while Bitcoin slips back below $73,000.
Two Red Days Erase $PEPE’s Edge
In the month to Nov 9, $PEPE gained about 33%, while Dogecoin and Shiba Inu each lost roughly 18%. Late on Wednesday, CoinMarketCap still showed it up around 70% over 90 days. Then a double-digit loss on Wednesday and more selling on Thursday pushed its weekly change to -9.8%.
Know when your coins move
Alerts, real-time prices, and market news — all in one app
Point your phone camera to install
4.8 based on 40K reviews in the App Store and Google Play
The drop also leaves $PEPE barely ahead of MemeCore (M) in the market cap rankings. MemeCore is the native coin of a layer-1 blockchain built for meme tokens. It ranks #41 with $1.81 billion, about $10 million behind $PEPE at #40, after losing just 1.05% on the day.
Meme Coins Lose a Quarter in a Month
Total meme coin market value is around $22 billion, down 25.63% over 30 days. Trading volume across the category rose 4.27% to $2.30 billion over the same 24 hours. When volume rises during a slide, it usually means holders are actively selling into the decline.
Dogecoin is still the sector’s heavyweight at $10.39 billion and lost only 2.5% on Thursday. Its 12.5% weekly decline, though, has left it near $0.066, close to a three-year low and on track for a seventh straight losing week. Pudgy Penguins (PENGU) did worst over seven days with a loss of almost 14%, and Official Trump (TRUMP) slipped 4.08% to $1.10.
Why the Leader Fell Hardest
Weeks of outperformance left $PEPE holders sitting on the largest unrealized gains in the meme sector, and traders who need to cut risk usually start there. Selling a winner locks in profit, while selling a coin already deep in the red turns a paper loss into a real one, so the strongest chart often becomes the source of cash once sentiment sours. The move can then speed up on its own: each leg lower pushes recent buyers below their entry price and can force the closing of leveraged long positions on derivatives exchanges.
Bitcoin trades near $72,500, after the broader market decline following the recent Binance exploit. U.S. spot Bitcoin ETFs lost $299.9 million on Wednesday, according to SoSoValue, their fifth straight day of outflows and about $1.44 billion in total since Nov 5.
Daily Chart Loses the 50-Day EMA
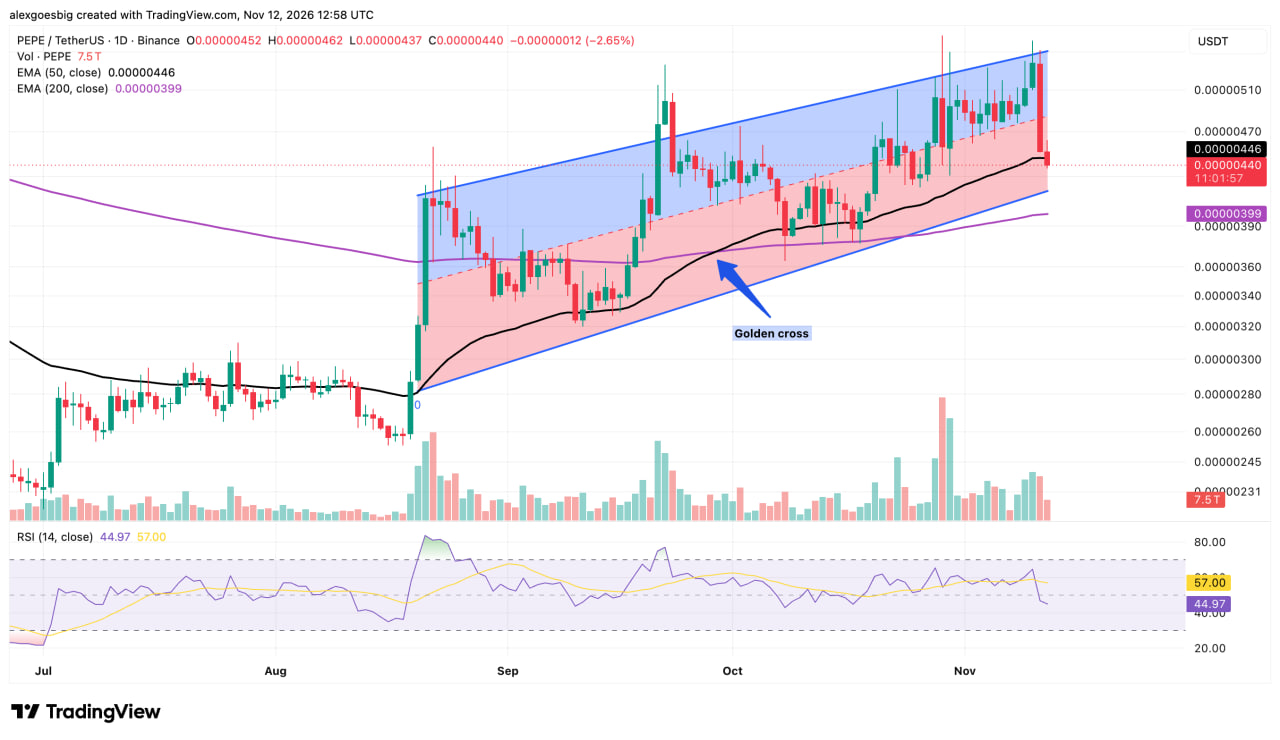
Since the second half of August, $PEPE has traded inside an ascending regression channel, which is a band drawn around the average path of the price. Thursday’s candle is down 2.65% so far at around $0.00000440, below both the channel’s midline and the 50-day EMA at $0.00000446.
$PEPE/$USDT daily chart with 50-day and 200-day EMAs and RSI. Source: TradingView / Alexander Stefanov
The golden cross from late September, when the 50-day EMA climbed above the 200-day EMA, still stands, and the slower average sits at $0.00000399. That keeps the medium-term structure tilted toward buyers, even though the short-term average has now become a ceiling. The 14-day RSI fell to 44.97, below the neutral 50 and below its own signal line near 57, which means sellers control momentum for now. At the same time, a reading this far above 30 shows the market has not yet reached the kind of exhausted selling that often comes before a rebound.
A daily close back above $0.00000446 would put the $0.00000470 to $0.00000480 area back in reach, with heavier resistance at $0.00000520 to $0.00000530 near the channel’s upper band. On the downside, the $0.00000390 to $0.00000400 zone is where the 200-day EMA meets the lower half of the channel. A decisive break there would end the structure that has held since August.
Four-Hour Chart Revisits an October Floor
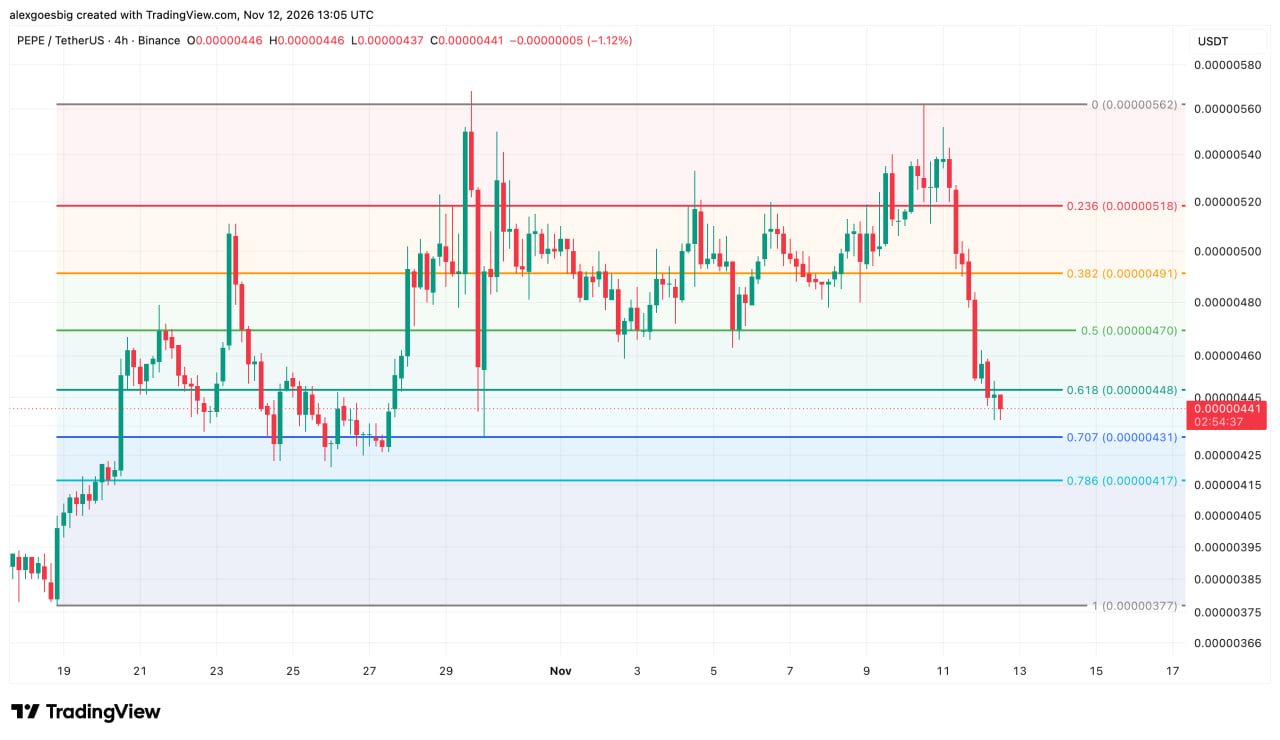
The Fibonacci retracement drawn from the Oct 19 low of $0.00000377 to the $0.00000562 peak shows how much ground the sell-off has covered. Starting near $0.00000540, a run of consecutive red four-hour candles carried $PEPE through the 0.382 level at $0.00000491, the 0.5 midpoint at $0.00000470 and the 0.618 level at $0.00000448 with almost no pause.
$PEPE/$USDT 4h chart with Fibonacci retracement levels. Source: TradingView / Alexander Stefanov
The next level, 0.707 at about $0.00000431, is where buyers stepped in on Oct 30, when a wallet linked to the Binance exploit reportedly sold about 7.77 trillion $PEPE worth roughly $31.7 million. The four-hour chart shows a long wick into this zone that day before buyers absorbed the supply and lifted the price back near $0.00000500. A four-hour close below $0.00000431 would bring the 0.786 level near $0.00000417 into play, and after that the October low. Buyers first need to win back $0.00000448, and only a move back above $0.00000470 would suggest the breakdown has run its course.
Signals to Track Into Month-End
Losing roughly another 1% against MemeCore would cost $PEPE its #40 spot, a symbolic loss for a token whose appeal depends heavily on how visible it is in exchange and aggregator rankings. A return to inflows in both daily ETF flows and stablecoin supply would be the first sign that new money is coming back into the sector.
Dogecoin’s weekly close on Sunday will show whether its losing streak reaches eight weeks.
$PEPE’s supply is fixed at 420.69 trillion tokens, with no unlocks or new issuance, so its price depends on demand alone. At current levels the token trades about 84% below its all-time high of $0.00002829, set in December 2024. It would have to rise to more than six times its current price to get back there.

 crypto-news-flash.com