Solana Price Prediction: Why Is SOL Falling as Tokenized Stock Trading Booms?
coinedition.com
52 m
Solana price prediction for November 13 stays bearish below $85, the level $SOL needs to reclaim after sliding about 34% from its late-September high.
Solana Price Analysis: Can $SOL Climb Back to $85?
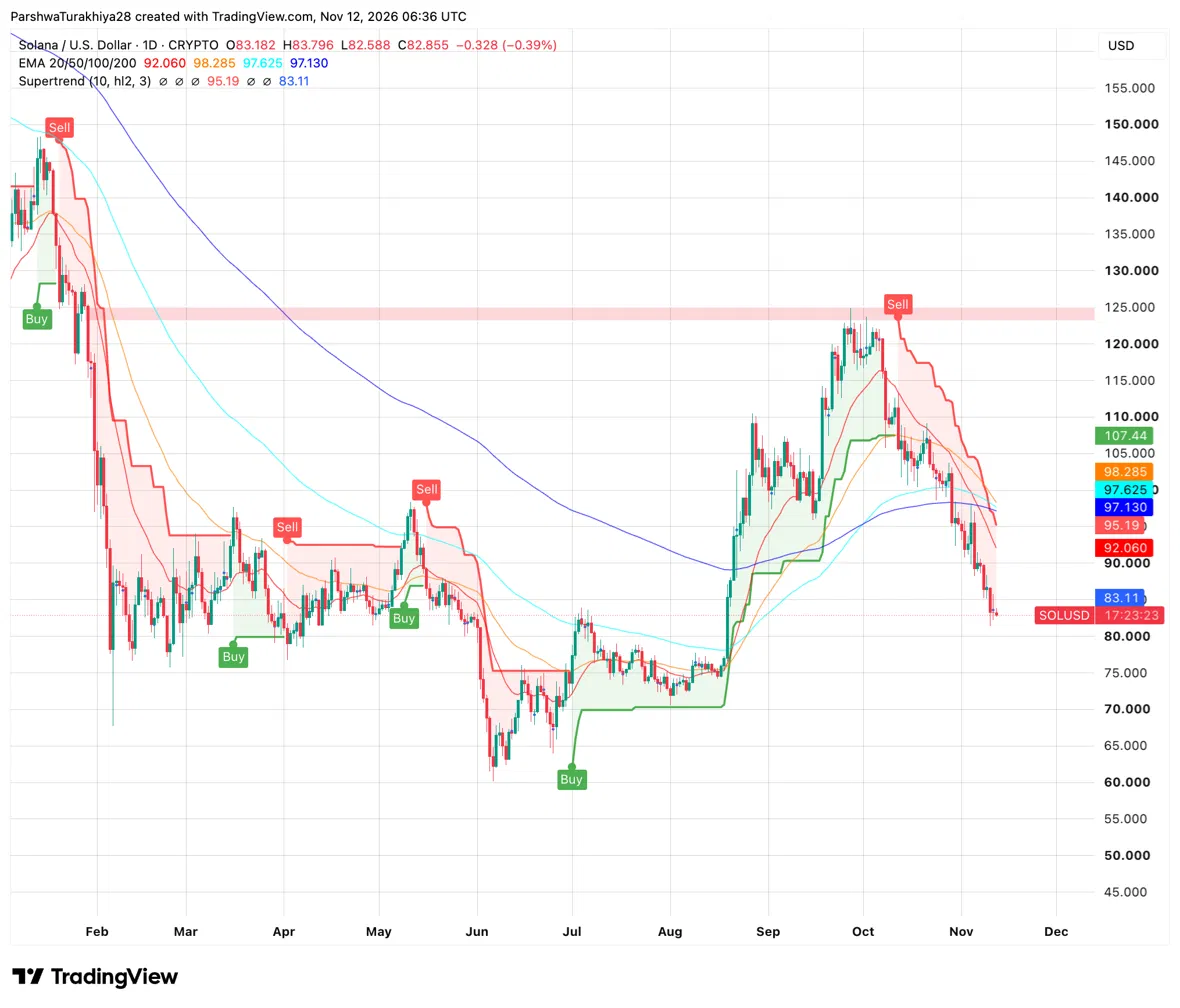
Solana Price Analysis (Source: TradingView)
$SOL is trading at $82.86 after losing $90, a level buyers had defended until early November. The token has fallen roughly 34% from September’s high near $125, erasing most of its August–September gains.
Know when your coins move
Alerts, real-time prices, and market news — all in one app
Point your phone camera to install
4.8 based on 40K reviews in the App Store and Google Play
Price remains below all four daily moving averages. The nearest is the 20-day EMA at $92.06, while the others cluster between $97.13 and $98.29. That leaves considerable resistance above any near-term bounce.
For November 13, $80-$85 is the immediate range to watch. A daily close above $85 would ease selling pressure and give buyers a chance to retest $90. A close below $80 would extend the breakdown, with $70 the next major round-number level to watch.
$SOL Support and Resistance Levels, November 13, 2026
Type
Price
Why it matters
Resistance
$85
Round level, near the $85.05 SoSoValue price on November 11
Resistance
$90
Round level, lost after November 3
Resistance
$92.06
20-day EMA
Support
$82.59
Today’s low
Support
$80
Round level
Support
$70
Round level, near the July and August lows
US Solana ETFs Lose $5.85M, Extending a Run of Outflows
US Solana Spot ETF Flows (Source: SoSoValue)
US spot Solana ETFs lost $5.85M on November 11, and SoSoValue’s table shows no inflow since October 22, a stretch of nine outflow sessions worth $112.10M. Fidelity’s FSOL lost $3.77M and Morgan Stanley’s MSOL lost $2.08M, about 64% and 36% of the day’s total.
Bitwise’s BSOL, the largest fund with $847.67M in assets, recorded no flows. Total net assets stand at $1.21B, down about 14% from $1.40B at the end of October. November’s outflows explain only about a sixth of that fall, so most of it came from price.
Solana Usage Keeps Growing, but $SOL Is Not Following
Solana’s network activity is strong, yet $SOL is about 34% below its late-September high and US spot ETFs are still selling. Adoption has not been setting the price.
Network usage: Token Terminal data, shared by SKS (@sallubroz) on X, shows 46.4 million monthly active addresses, 2.71 million daily active addresses and a $14.56B stablecoin market cap. The post also says Alpenglow, an upgrade targeting about 150 milliseconds of finality, went live, and it names stablecoin supply and user retention as the open risks.
Wall Street products: The same post says J.P. Morgan Asset Management brought tokenized money market funds to Solana.
Tokenized stocks: On the Milk Road podcast, host John Gillan said $657 million of tokenized stocks traded on Solana in one day last week, about 90% of it on Backpack, and that Backpack added more than 200,000 tokenized stockholders in a month. The guest was Backpack’s CEO, Armani Ferrante, so these figures come from the platform’s own side and are unverified.
Benjamin Cowen Says Markets Keep Dumping Into Thursday and Friday
Has anyone noticed the pattern with Bitcoin/stocks?
1) Market dumps into Thursday/Friday 2) Bears call for Black Monday over the weekend 3) Market rallies Monday-Wednesday 4) Bulls make fun of bears 5) Go back to step 1
Perhaps the time to pivot is after this pattern breaks?
— Benjamin Cowen (@benjamincowen) November 6, 2026
Benjamin Cowen (@benjamincowen) said Bitcoin and stocks have repeated the same weekly loop. The market dumps into Thursday or Friday, bears call for a Black Monday over the weekend, the market rallies from Monday to Wednesday, bulls mock the bears, and the cycle starts again. He added that the time to pivot may come after the pattern breaks.
Related: Top 3 Price Prediction: Bitcoin (BTC), Ethereum (ETH), and $XRP ($XRP)
November 13 is a Friday, so the loop points to more weakness into Friday and a rebound from Monday. It is an observation without data, and it covers Bitcoin and stocks, not $SOL specifically, so it adds a timing risk more than a signal.
Solana Price Prediction Scenarios for November 13
Bullish Case, Target: $85
$SOL holds today’s low at $82.59, closes above $83.80 and reclaims the $85 round level, about 3% above today’s price. A close above it would open the 20-day EMA at $92.06, about 11% higher. A pause in ETF outflows and a rebound across the wider market would fit this path.
Bearish Case, Risk Level: $80 (Round Level)
$SOL closes below today’s low at $82.59 and then $80, about 3% below today’s price. That would put $70 in play, about 16% lower, near the July and August lows. Another ETF outflow and a Friday sell-off of the kind Cowen describes would fit this path.
FAQs
What is the Solana price prediction for November 13, 2026?
$SOL stays bearish below $85 and could move toward that level if it holds today’s low at $82.59 and closes above $83.80. A daily close below $80 would put $70 in play.
Why is the Solana price falling?
$SOL trades about 34% below its late-September high near $125 and under all four daily EMAs, and US spot Solana ETFs lost $5.85M on November 11. None of the data in this analysis ties the drop to a single cause, and network usage has grown while the price has fallen.
Are Solana ETFs seeing outflows?
US spot Solana ETFs lost $5.85M on November 11, and SoSoValue’s table shows no inflow since October 22. Cumulative net inflow stands at $1.44B.
What is the key support level for Solana?
$80, the round level below today’s low at $82.59, is the key support. A close below it would put $70, near the July and August lows, in play.
Related: Midnight Price Prediction November 2026: Can NIGHT Clear $0.0532 After a 8% Jump?

 coinedition.com