Mixed DEX activity meets a defensive market backdrop
On-chain trading activity on Arbitrum is mixed and the broader market backdrop remains defensive, offering no clear confirmation for an $ARB recovery. CoinGecko puts total crypto market capitalization at $2,509,841,380,989.95 and Bitcoin dominance at 59.67%.
Alternative.me’s Fear & Greed Index reads 32, classified as Fear. That sentiment backdrop warrants skepticism toward an unconfirmed $ARB recovery, though it does not establish what caused the token’s move.
The supplied data report $204,338,279.52 in trading volume over 24 hours across DEXs on the Arbitrum blockchain. Venue activity is mixed: one-day trading volume increased 26.13% at Uniswap V3, 25.54% at Uniswap V4 and 27.52% at PancakeSwap AMM V3, while Fluid DEX recorded a 21.72% decline.
These are chain-wide venue figures, however, not $ARB-specific trading volume or token revenue. They do not establish a broad surge in demand for $ARB. On November 3, 2026, Arbitrum’s council moved $30 million of Binance hack funds without the hacker’s key. The intervention adds governance context, but the supplied price data do not establish a connection between that event and the current technical weakness.
Arbitrum price remains caught between daily support and hourly weakness
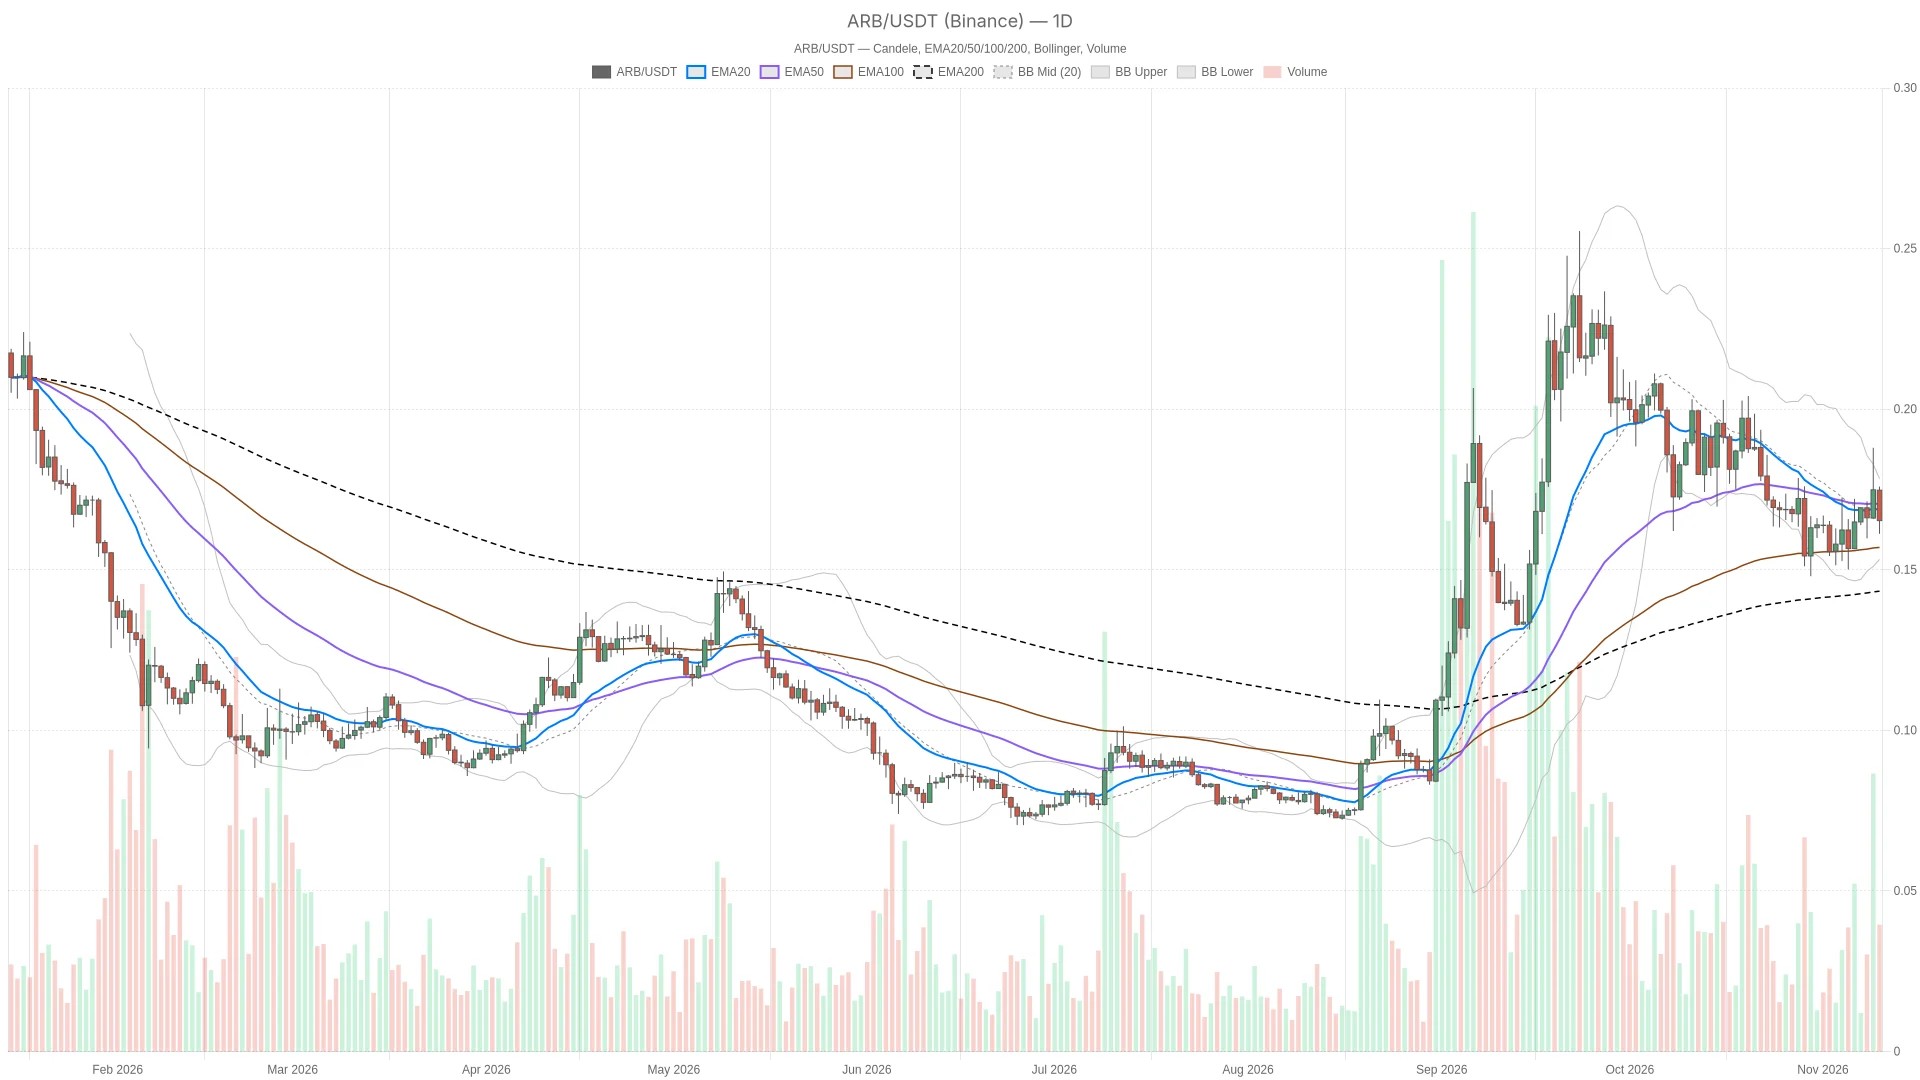
The daily chart defines the main scenario as neutral, with price below the shorter EMAs but above the 200-period average. $ARB/$USDT sits beneath the daily EMA20 at $0.1691 and EMA50 at $0.1707, yet it remains above the daily EMA200 at $0.1431.
The averages are not aligned. In practice, the longer-term reference remains intact while the nearer-term structure blocks a clean bullish reading. The immediate rebound looks more like an attempt at mean reversion than an established change of trend.
The hourly chart weakens that daily balance. At $0.1656, price is below all three hourly EMAs: the EMA200 at $0.1673, EMA20 at $0.1697 and EMA50 at $0.1711. Their ordering is mixed, rather than textbook bearish, but price beneath every average still leaves the rebound facing overhead resistance.
The 15-minute chart provides execution context only. Price is above its EMA20 at $0.1650, yet below its EMA50 at $0.1678 and EMA200 at $0.1712. Those averages have a bearish alignment, showing a local recovery inside a weaker structure rather than evidence strong enough to override the daily bias.
Improving momentum has not yet repaired the price structure
Daily RSI at 52.4 and a widening positive MACD histogram confirm improving momentum on completed candles. Price, however, remains below the shorter daily averages, meaning momentum is ahead of structural confirmation. The conflict is explicit: those readings are constructive, but the live price remains beneath the shorter daily averages.
Hourly RSI has recovered to 34.7 across the supplied completed readings. Its MACD histogram remains negative but is narrowing, showing that bearish momentum is easing rather than that bullish control is established.
On the 15-minute chart, RSI is 44.4 and the positive MACD histogram is widening. That combination supports the bounce without making it a convincing trend reversal.
The daily Bollinger midpoint at $0.1669 sits above price, with the lower band at $0.1511 and upper band at $0.1828. Trading beneath the midpoint keeps the immediate setup in the lower half of the daily range. A recovery toward the midpoint would first be a mean-reversion move, not automatically a breakout.
Daily ATR is $0.01422, compared with hourly ATR of $0.002873. These readings describe substantial movement relative to the nearby technical thresholds. A brief crossing of a level is therefore less persuasive than a completed candle confirming it.
Hourly $0.1663 resistance separates a rebound from another support test
The hourly R1 at $0.1663 is the immediate resistance that would confirm a local breakout on an hourly close above it. The hourly pivot at $0.1643 marks the downside trigger. The nearest daily support is daily S1 at $0.1645, while the nearest daily resistance is the Bollinger midpoint at $0.1669.
The daily pivot at $0.1762 remains farther overhead, a reference for a broader recovery rather than the immediate trigger. Intraday, the hourly pivot at $0.1643 is support, hourly R1 at $0.1663 is resistance, and hourly S1 at $0.1623 is the next support below the pivot.
Bullish scenario: An hourly close above hourly R1 at $0.1663 would confirm a local resistance break, opening a test of the daily Bollinger midpoint at $0.1669 and then the hourly EMA200 at $0.1673. An hourly close below the hourly pivot at $0.1643 would invalidate that bullish setup. Even a successful initial break would leave the broader daily repair unfinished.
Bearish scenario: An hourly close below the hourly pivot at $0.1643 would confirm renewed intraday weakness and expose hourly S1 at $0.1623. An hourly close above hourly R1 at $0.1663 would invalidate that bearish setup. The last completed hourly candle closed at $0.1644, so the downside trigger has not yet been satisfied.
The likeliest false signal is a brief upside break driven by the improving short-term momentum readings that fails beneath the overhead averages. Conversely, a temporary dip below support could reverse while hourly bearish momentum continues to narrow. ATR and the disagreement between timeframes make candle confirmation central to both scenarios.
FAQ
Are the quoted live prices completed candle closes?
No. The live daily and intraday prices refer to candles still open. Indicators use completed candles, which explains why improving momentum readings can coexist with weaker live prices.
Does Arbitrum’s DEX activity confirm demand for $ARB?
No. The supplied DEX volume figures describe trading across venues on the blockchain, not trading specifically in $ARB, and the venue-level changes are mixed.
Disclaimer: This article is for informational purposes only and does not constitute financial advice, an investment recommendation, or a solicitation to buy or sell any financial instrument or cryptocurrency. The analysis provided is not indicative of future results. Investing in crypto assets and financial markets carries a high risk of capital loss. Always do your own research (DYOR) and consult a qualified financial advisor before making any decision.
Article produced with the assistance of artificial intelligence and reviewed by the editorial team.

 en.cryptonomist.ch