Key takeaways
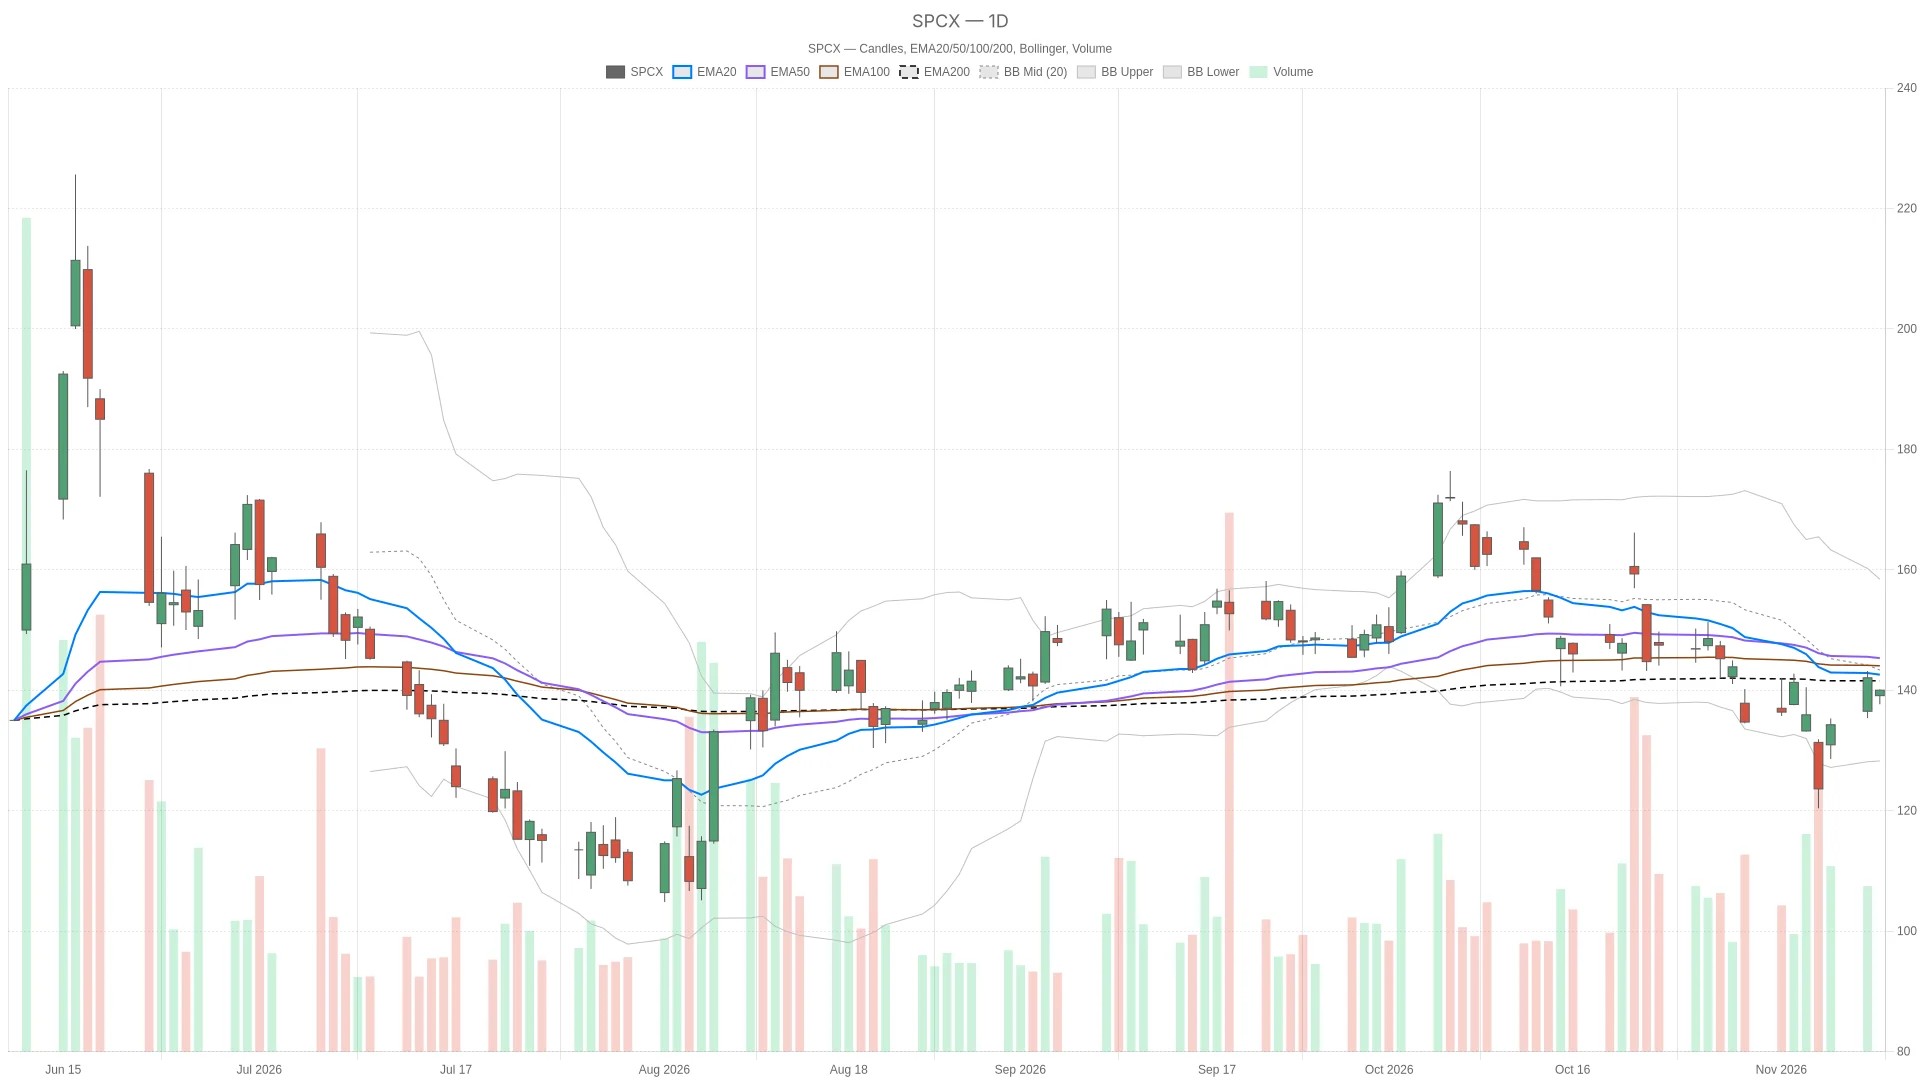
- Nasdaq SPCX was trading at $140.01 as of 09:36 ET, down 1.45% versus the previous close.
- Daily RSI14 is 47.02, below 50; daily MACD line is -4.18, below its signal at -3.57, with a negative histogram of -0.61.
- Price is below the daily 20-session EMA at $142.59 and 50-session EMA at $145.99.
- Hourly RSI14 is 57.96, above 50; hourly MACD line is 1.98, above its signal at 0.88, with a positive histogram of 1.1.
- Price is below the daily pivot at $140.21; daily first support (S1) is $137.23 and first resistance (R1) is $145.06.
Nasdaq SPCX: Daily Resistance Defines the Main Bias
Overall, the daily structure favors caution. Nasdaq SPCX sits below its key daily moving averages, keeping the bearish assessment intact.
Price Sits Below the Daily Moving Averages
Price sits below the 20-session EMA at $142.59 and the 50-session EMA at $145.99. Meanwhile, the shorter average also sits below the longer one. Together, those positions leave the bullish case dependent on clearing overhead resistance.
Momentum and Volatility Readings
Meanwhile, daily RSI14 stands at 47.02, below the neutral 50 threshold. The daily MACD line is -4.18, below its signal at -3.57, with a negative histogram of -0.61. These readings support the bearish daily assessment. However, the histogram increased to -0.61 from -1.13, making that negative reading less pronounced.
At the same time, daily ATR14 declined to $8.07 from $8.35. That provides a smaller volatility reference than the preceding reading.
Bollinger Bands and Pivot Levels
Price also sits below the daily Bollinger midpoint at $143.35, between the lower band at $128.26 and upper band at $158.44. Consequently, that places it in the lower half of the daily envelope.
Notably, the daily pivot at $140.21 is just above the current price. At the same time, daily first support (S1) is $137.23, while first resistance (R1) stands at $145.06. These levels come from the previous completed daily candle and apply to the current session.
Hourly Strength Complicates the Daily Picture
In contrast to the daily setup, the hourly chart offers a firmer tone. Price is above the hourly 20-period EMA at $137.15 and 50-period EMA at $137.49.
Still, it remains below the hourly 200-period EMA at $145.45. However, this is not a fully bullish alignment: the hourly 20-period average is below the 50-period average.
Hourly RSI14 is 57.96, above 50. The hourly MACD line at 1.98 is above its signal at 0.88, with a positive histogram of 1.1. These readings oppose the daily bearish momentum signals. Nevertheless, price remains below the hourly pivot at $141.96 and hourly first support (S1) at $141.38, leaving overhead hurdles intact.
Short-Term Timing and News Context
On the 15-minute chart, however, the picture is less decisive. Price is below the 20-period EMA at $140.83 and the lower Bollinger band at $140.48.
RSI14 is 53.96, above 50, but the MACD line at 1.04 is below its signal at 1.38. The negative histogram of -0.34 makes this an uneven execution backdrop rather than confirmation of hourly strength.
Meanwhile, 15-minute ATR14 increased to $1.16 from $0.91. Notably, that higher short-term volatility reading contrasts with the lower daily ATR. The 15-minute signals matter for timing, but they do not override the daily bias.
News coverage provides separate context. A report published on Monday, November 9, said SpaceX had proposed constructing, owning, and operating a gas-fired power plant. The plan includes a super-compute facility in the City of Starbase. A report published before Tuesday’s open said Flight 15 will test improved Starship heat-shield tiles for reuse.
Bullish and Bearish Conditions
A bullish scenario requires price to clear the daily pivot at $140.21, followed by the hourly pivot at $141.96. Moving above the daily 20-session EMA at $142.59 would strengthen that case. Daily first resistance at $145.06 would then be the next named daily hurdle. Hourly positive momentum offers support, but daily RSI and MACD do not yet confirm it.
Conversely, remaining below those resistance levels preserves the bearish daily assessment. A break below daily first support at $137.23 would undermine the bullish scenario. The hourly 20-period EMA at $137.15 sits immediately below that level. The daily lower Bollinger band is farther below at $128.26.
Overall, Nasdaq SPCX stands below its daily pivot and key daily averages, despite supportive hourly momentum readings. Daily ATR is $8.07. Whether hourly strength can translate into a break above daily resistance remains unresolved.
FAQ
Is Nasdaq SPCX’s daily trend bearish or bullish?
The daily structure is bearish. Price is below the 20-session EMA at $142.59 and the 50-session EMA at $145.99. Daily RSI14 is 47.02, below 50, and the daily MACD line is -4.18, below its signal at -3.57.
What do the hourly signals show for Nasdaq SPCX?
The hourly chart offers a firmer picture. Price is above the hourly 20-period EMA at $137.15 and 50-period EMA at $137.49. Hourly RSI14 is 57.96, above 50, and the hourly MACD line at 1.98 is above its signal at 0.88.
What are the key levels to watch for Nasdaq SPCX?
The daily pivot is $140.21, just above the current price of $140.01. Daily first support (S1) is $137.23 and first resistance (R1) is $145.06. The daily 20-session EMA at $142.59 and hourly pivot at $141.96 are also overhead hurdles.
Disclaimer: This article is for informational purposes only and does not constitute financial advice, an investment recommendation, or a solicitation to buy or sell any financial instrument. The analysis provided is not indicative of future results. Investing in financial markets carries a high risk of capital loss. Always do your own research (DYOR) and consult a qualified financial advisor before making any decision.
Cryptonomist and the author hold no positions in the financial instruments mentioned and receive no compensation from the companies covered.
Article produced with the assistance of artificial intelligence and reviewed by the editorial team.

 en.cryptonomist.ch