Solana price faces bearish short-term confirmation, not a recovery signal
Short-term price action confirms bearish momentum across the hourly and 15-minute charts, offering no convincing evidence of a turn. A stretched decline can produce a sharp recovery without repairing the broader setup, and for now the shorter timeframes reinforce the downside bias.
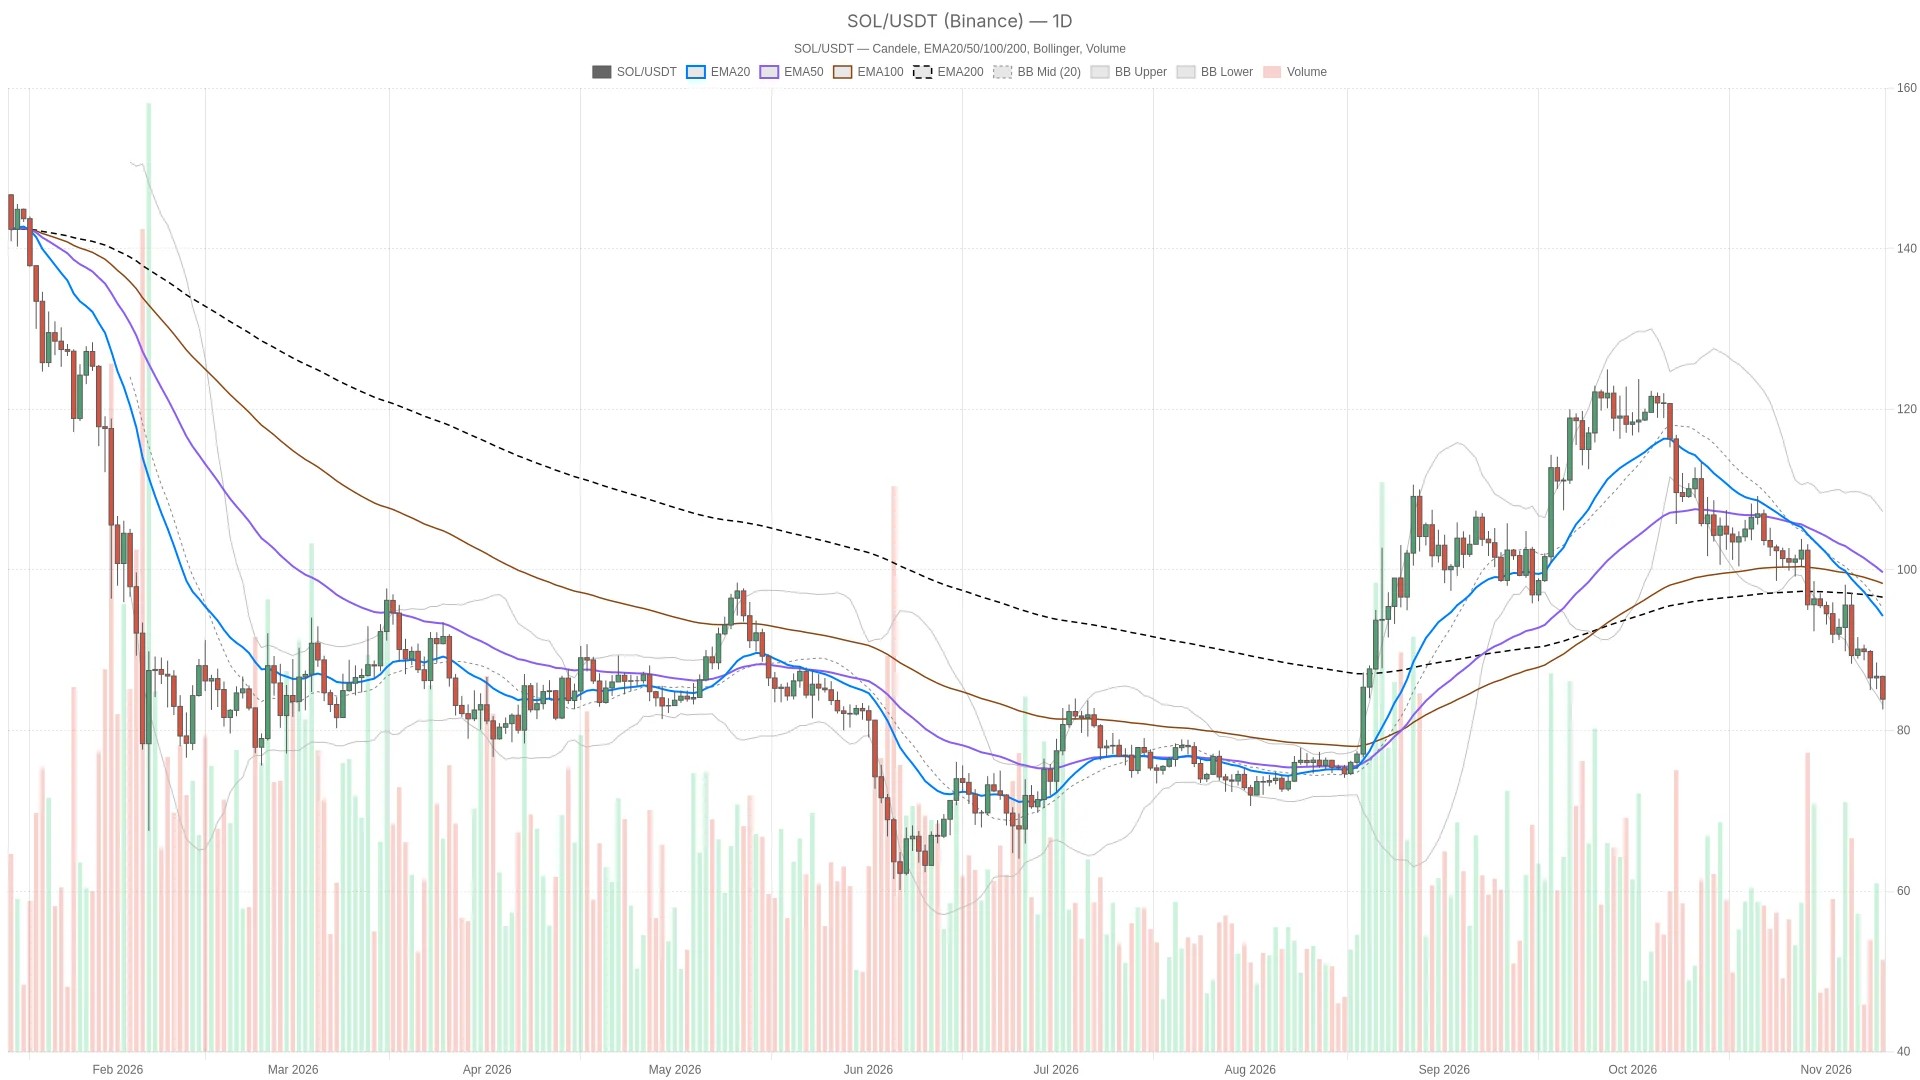
The last completed daily candle closed at $86.74, while the live daily candle trades lower. That separates an established closing reference from an unfinished move: the current price is not a confirmed daily close. Both the hourly and 15-minute regimes are bearish. Their last completed candles closed at $84.13 and $84.16, respectively, against live readings of $83.90. There is little directional disagreement across the charts. The real tension is between downside structure and the possibility of mean reversion after an extended move—not between a bullish short-term trend and a weak daily chart.
Price below every EMA leaves rebounds facing overhead barriers
With price trading below all tracked daily and intraday EMAs, any rebound must clear multiple overhead barriers before challenging the broader trend. Binance candle data place price below the daily EMA20 at $95.33, EMA50 at $100.32 and EMA200 at $96.71. Those averages are not aligned, so this is not a textbook bearish daily EMA stack. Nevertheless, trading beneath each one leaves the broader recovery unproven.
The shorter-term structure is more decisive. Price is below the hourly EMA20 at $85.76, EMA50 at $86.83 and EMA200 at $90.36, with a bearish alignment. It is also below the 15-minute EMA20 at $84.82, EMA50 at $85.40 and EMA200 at $86.79, again with a bearish alignment. For execution context, that makes a brief upward move less persuasive than a sustained recovery through overhead levels.
The daily Bollinger lower band at $84.44 is above current price; the daily midpoint is $96.35 and the upper band is $108.26. The hourly lower band at $84.41 is also overhead, beneath its $85.95 midpoint and $87.49 upper band. Price outside both lower bands marks downside extension, but extension alone does not establish a bottom. Daily ATR is $4.42, compared with hourly ATR of $0.8815 and 15-minute ATR of $0.5044. Those ranges put the nearby technical barriers in perspective: a small reclaim can fit comfortably inside ordinary candle movement, while a close through a level carries more weight than an intrabar touch.
Daily RSI is oversold while MACD still favors downside momentum
Daily RSI at 27.4 signals firmly oversold conditions, yet negative MACD readings across all three timeframes keep downside momentum in control. Hourly RSI is 30.2 and falling, while 15-minute RSI is 30.6 with flat recent direction. The daily reading creates a credible rebound setup, but the shorter readings do not yet provide persuasive momentum confirmation.
MACD offers the opposing evidence. Its histogram is negative on all three timeframes, with widening negative magnitude in the supplied trend readings. The combination is uncomfortable for either extreme view: oversold RSI argues against assuming an effortless continuation, while negative MACD argues against treating a bounce as a reversal.
The hourly pivot at $83.99 separates a reclaim from renewed downside
The hourly pivot at $83.99 acts as the immediate dividing line between a potential recovery and further downside pressure. The nearest resistance above it is the hourly Bollinger lower band at $84.41, followed by the daily Bollinger lower band at $84.44. The daily S1 at $85.10 is also resistance at the current price, despite its support-style label. Higher recovery references are hourly R1 at $85.38, the daily pivot at $86.78 and daily R1 at $88.42. Below price, hourly S1 at $82.75 is the nearest listed support.
Bullish scenario: an hourly close above $84.44
An hourly close above the daily Bollinger lower band at $84.44 would establish a countertrend recovery through both nearby lower-band barriers. That would bring daily S1 at $85.10 into focus, followed by hourly R1 at $85.38. An hourly close back below the hourly pivot at $83.99 would invalidate this rebound scenario. Even a successful trigger would repair local structure, not the distant daily EMA framework.
Bearish scenario: an hourly close below $83.99
An hourly close below the hourly pivot at $83.99 would confirm the live break beneath that level and favor a test of hourly S1 at $82.75. The last completed hourly candle remains above the pivot, so this closing trigger is not yet satisfied. An hourly close above the daily Bollinger lower band at $84.44 would invalidate this immediate bearish continuation setup.
The likeliest false signal is a brief reclaim of the hourly pivot that fails beneath the lower-band barriers. Oversold daily RSI also leaves the bearish scenario exposed to an abrupt rebound. With nearby levels inside the reported volatility ranges, neither a quick upside wick nor a momentary downside break settles the contest.
Mixed DEX activity does not confirm a broad recovery
Chain-wide DEX data record $1.49 billion in 24-hour DEX trading volume across the Solana blockchain. Venue activity is mixed: PumpSwap volume rose 54.90% over one day, BisonFi rose 51.85%, and HumidiFi fell 49.10%. These are chain-wide trading-activity measures, not $SOL-specific volume, fees or revenue. They do not provide uniform confirmation of stronger demand for the asset.
Formation has notified the SEC about a planned tokenized-stock venue on Solana. That adds development context, but the plan is not technical evidence that the current price weakness has ended.
Fear at 32 frames a defensive market backdrop
A Fear & Greed Index reading of 32 reflects defensive sentiment, consistent with the broader market backdrop. CoinGecko puts total cryptocurrency market capitalization at $2.48 trillion and Bitcoin dominance at 59.59%. The capitalization and dominance figures describe the current market backdrop—not a direction of capital rotation.
FAQ
Is Solana’s daily trend classification bearish?
The supplied daily regime is neutral. The bearish directional assessment comes from price below all tracked daily EMAs and negative MACD momentum, rather than from that regime label.
Does oversold RSI confirm a bottom?
No. Daily RSI is oversold, but negative MACD across the tracked timeframes leaves the rebound case conditional on price confirmation.
Disclaimer: This article is for informational purposes only and does not constitute financial advice, an investment recommendation, or a solicitation to buy or sell any financial instrument or cryptocurrency. The analysis provided is not indicative of future results. Investing in crypto assets and financial markets carries a high risk of capital loss. Always do your own research (DYOR) and consult a qualified financial advisor before making any decision.
Article produced with the assistance of artificial intelligence and reviewed by the editorial team.

 en.cryptonomist.ch