Bitcoin Price Prediction: 2023 Retest Pattern Maps BTC Price if $74K Support Holds
thecryptobasic.com
4 h
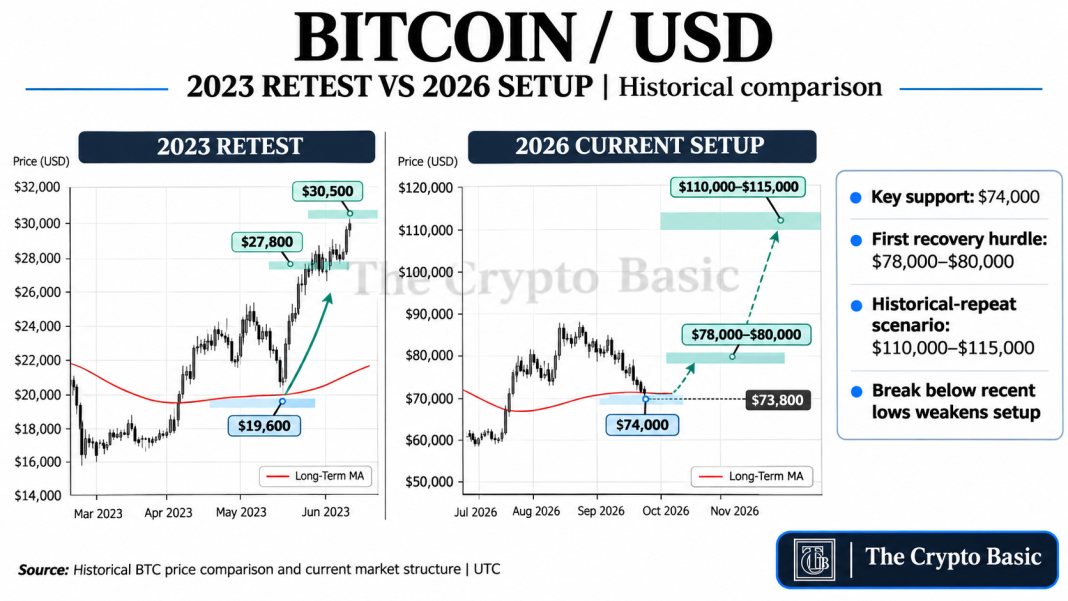
Bitcoin has returned to a long-term support area near $74,000, creating a structure that resembles the 2023 pullback that preceded $BTC’s advance toward $30,000.
Bitcoin currently trades around $73,800, after falling to approximately $73,570 over the latest 24 hours.
The historical comparison does not require Bitcoin to repeat 2023, but it provides a useful scenario if buyers can again defend the long-term trend.
Know when your coins move
Alerts, real-time prices, and market news — all in one app
Point your phone camera to install
4.8 based on 40K reviews in the App Store and Google Play
Bitcoin’s 2023 Retest Preceded a Sharp Recovery
Bitcoin entered 2023 recovering from the previous bear market but suffered a substantial pullback in March.
Bitcoin is retesting long-term support near $74,000 in a structure resembling March 2023, when $BTC rebounded from around $20,000 and later cleared $30,000.
On March 10, $BTC fell as low as approximately $19,628 before recovering. By March 17, Bitcoin had already reached $27,788, and the advance eventually carried price above $30,000 in April.
Using the March low and April 11 high near $30,550, Bitcoin advanced roughly 55%.
The important feature was not simply the percentage gain. The March correction returned $BTC toward the rising long-term moving-average area after price had already broken above it earlier in the year. Buyers defended that retest, allowing the recovery trend to resume.
A similar test is now developing around the mid-$70,000s.
$74,000 Becomes Critical for the 2026 Setup
Bitcoin’s recent decline has taken price back toward approximately $74,000-$75,000, where the current long-term support curve is positioned.
The Crypto Basic’s latest Price Desk analysis showed $BTC closing Monday at $75,253 before slipping back below $74,891 on shorter timeframes. Bitcoin also remains beneath its falling 20-day EMA at $78,106 and 50-day EMA at $79,232, meaning the short-term trend has not yet turned bullish. Bitcoin’s latest daily technical setup.
That makes $74,000 support only the first part of the setup.
Bitcoin would next need to recover roughly $78,000-$80,000 before the comparison with 2023 begins gaining stronger confirmation.
The Crypto Basic previously tracked Bitcoin’s reclaim of its 50-week moving average, another longer-term trend level that remains relevant as the market attempts to establish support.
Historical Repeat Would Put $110K–$115K in Focus
If Bitcoin eventually produces a recovery comparable to the March-April 2023 advance, the upside becomes substantial.
A 50% move from $74,000 would put $BTC near $111,000.
Repeating the approximately 55% advance from the March 2023 low to the April high would place Bitcoin around $114,700.
That creates a conditional historical-repeat range around $110,000-$115,000.
Those levels should not be treated as automatic targets. Bitcoin would first have to clear nearer obstacles around $80,000, followed by the previous price structure toward the mid-$80,000s and ultimately the $100,000 psychological level.
The longer-term scenario also fits with the wider post-midterm framework previously examined by The Crypto Basic, which produced a November 2027 base range around $110,000-$120,000 when prior midterm-cycle returns were applied to the 2026 starting point.
What Would Invalidate the Comparison?
The 2023 analogy depends on Bitcoin actually defending the current support region.
A sustained breakdown beneath the latest lows around $73,400-$73,600 would weaken the immediate rebound attempt. Bitcoin would then need to establish another support base before a 2023-style recovery could become relevant.
For now, the next observable test is whether $BTC can hold the $74,000 region and recover $78,000-$80,000. If that occurs, the historical comparison would leave $100,000 as the first major psychological hurdle before a larger $110,000-$115,000 scenario comes into view.

 thecryptobasic.com