ASTER Price Breakdown Leaves October Buyers Underwater
crypto-news-flash.com
38 m
$ASTER price has lost the support level that held through October.
Three lower peaks since September point to steadily fading demand.
Heavy volume on the drop contrasts with a weak, low-volume bounce.
The broken floor now acts as the main barrier for any recovery.
The $ASTER price slipped to around $0.6398 on Monday after a 5.79% loss in 24 hours, according to CoinMarketCap data, pushing the governance token of the Aster perpetual futures exchange, issued on BNB Chain, below the $0.68 level buyers had defended for most of October and cutting its market capitalization to $1.77 billion. The drop ended several weeks of sideways trading and briefly took the token to $0.6240, and because the 7-day loss now stands at 8.26%, the move looks less like a one-session shakeout and more like the end of a structure that had been weakening since September. The slide also unfolded against a weak backdrop for the wider market, after Bitcoin’s drop to $76,000 on November 5 triggered more than $1 billion in liquidations of leveraged positions, most of them bets on rising prices.
Three Peaks, Each Lower Than the Last
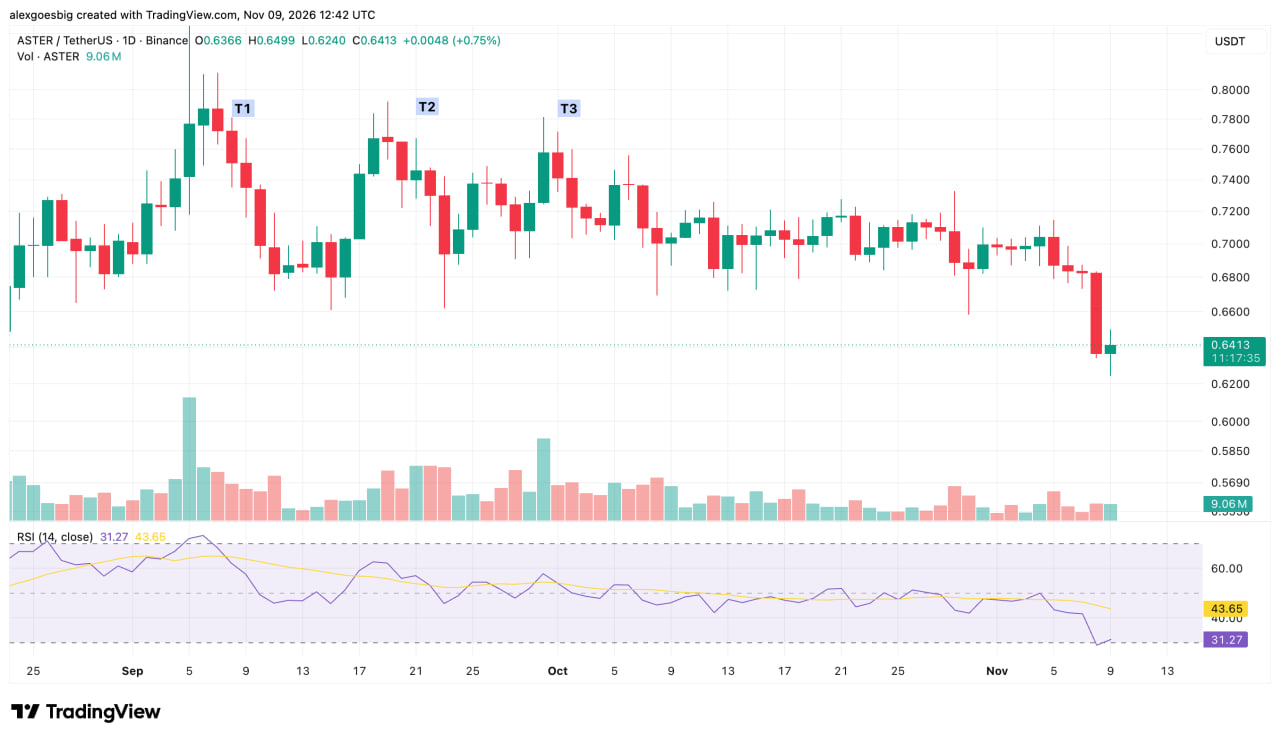
$ASTER/$USDT daily price structure and RSI. Chart: Alexander Stefanov / TradingView.
Know when your coins move
Alerts, real-time prices, and market news — all in one app
Point your phone camera to install
4.8 based on 40K reviews in the App Store and Google Play
Looking back at the daily chart, $ASTER put in three highs between September and early October, near $0.79 in early September, $0.77 around September 19-20 and $0.76 at the turn of the month. Many traders would call this a potential triple top, a pattern in which price fails three times near the same ceiling, although a textbook version needs three highs at roughly the same level and one clear floor whose loss confirms it. $ASTER’s peaks step down instead, and each rally stopping at a lower price shows sellers growing more willing to exit.
October’s Range Gave Way on Heavy Volume
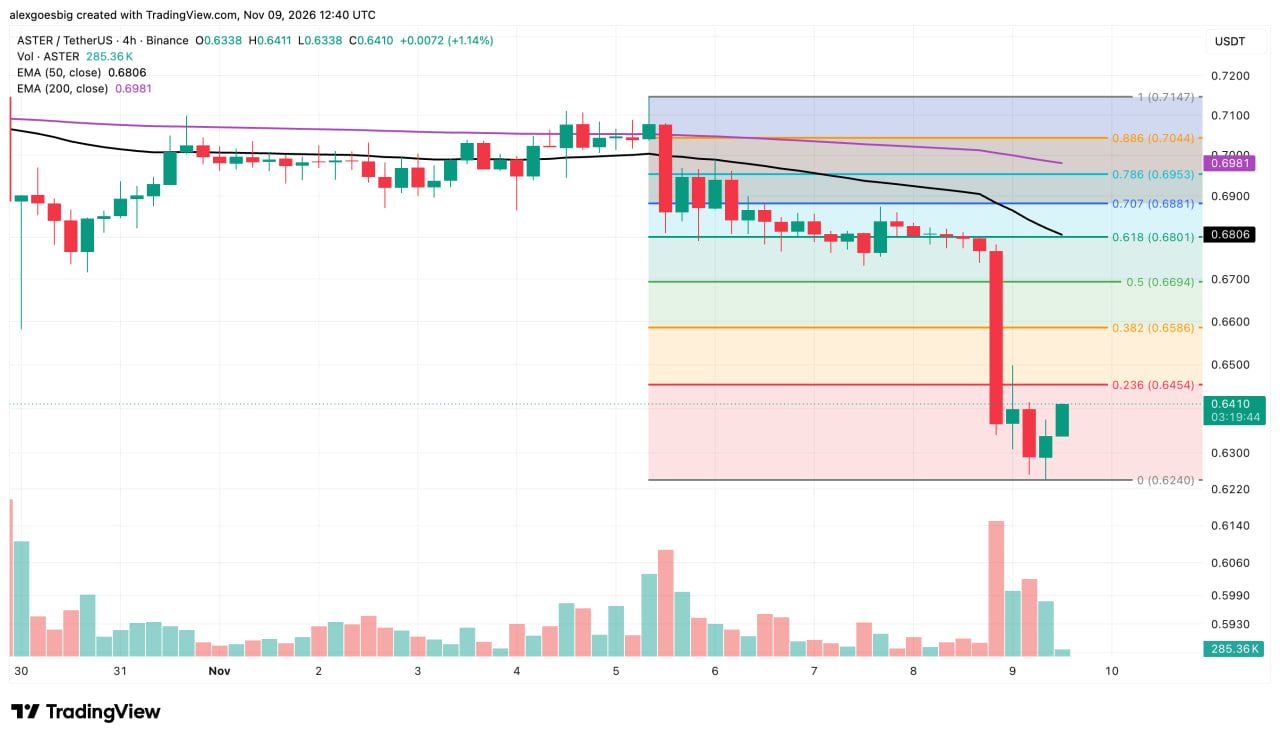
Through October the token moved between $0.68 and $0.72, with buyers defending the lower edge while momentum weakened underneath. The range broke on November 9, when a large red candle came with one of the biggest volume spikes on the four-hour chart in recent weeks. The rebound from $0.6240 has been small and has arrived on much lighter volume, which looks more like a pause in selling than a return of committed buyers.
The daily RSI, a momentum gauge running from 0 to 100, has dropped to 31.32, near the 30 mark that usually signals oversold conditions. That makes a relief bounce plausible, but readings this low can persist for weeks during a strong decline and do not by themselves mark a bottom.
Why the Old Floor Now Caps Rallies
When a level like $0.68 holds for weeks, many traders buy there. Once price falls through it, those buyers are sitting on losses, and a good share of them tend to sell as soon as price returns to their entry so they can exit at breakeven. That steady supply is what turns a former floor into a ceiling.
Two other tools point to the same price. The 50-period exponential moving average on the four-hour chart, which tracks the average price of roughly the last eight days with more weight on recent candles, sits at $0.6806. The 0.618 Fibonacci retracement, a level traders use to measure how much of a decline has been recovered, sits at $0.6801. When the old support, a trend average and a widely watched retracement line up within a fraction of a cent, a large number of sell orders tend to cluster there.
A second cluster sits higher. The 200-period average, a longer trend gauge covering about a month of four-hour candles, is at $0.6981, close to the 0.786 retracement at $0.6953. Both averages are above the current price, which means anyone who bought in the past month is, on average, losing money.
Level
Price
What it means
Upper resistance
$0.6980-$0.7044
Longer trend average and deep retracement
Major resistance
$0.6800-$0.6806
Former floor, 50 EMA and 0.618 level
First hurdle
$0.6454
Needs to hold for any recovery to start
Support
$0.6240
Low of the latest sell-off
Round number
$0.6000
Psychological level, untested on these charts
Key $ASTER levels from the daily and four-hour charts.
Three Paths From the $0.62 Low
$ASTER/$USDT 4H technical analysis. Chart: Alexander Stefanov / TradingView.
The first test is $0.6454, the 0.236 retracement that the current bounce is pressing against. If $ASTER holds above it on rising volume, the next stops are $0.6586 and $0.6694, with the $0.68 cluster above them. Recovering $0.68 would repair the short-term damage, although it would still leave the token below the September peaks and short of anything resembling a new uptrend.
A second outcome is a few days of sideways movement between $0.6240 and $0.6454. That kind of pause often lets the RSI recover without much price progress, and it can set the stage for the next directional move in either direction.
The bearish case starts with another rejection under $0.6454 and a return to the low. A four-hour or daily close below $0.6240, particularly if volume rises again, would bring the $0.60 round number into view. That level has no confirmed history as support on these charts, so its value lies mostly in the attention it draws from traders.
A Token Still Far From Its Launch-Era Highs
$ASTER launched in September 2025 and climbed to around $2.42 in its first weeks of trading, so the current $ASTER price sits roughly 74% below that peak, and the latest breakdown extends a long repricing that predates this year’s range. The 1.24% gain over the past hour shows buyers stepping in around the lows, but the next useful piece of evidence will come from volume. A bounce that runs into $0.6454 on thin trading would look much like the rebound that has already stalled, while a push through it with turnover approaching the November 9 sell-off would be the first sign that the buying on the way down is more than short covering.

 crypto-news-flash.com