XRP Price Analysis: Bearish EMA Crossover Puts $0.9862 Support at Risk
coinedition.com
17 m
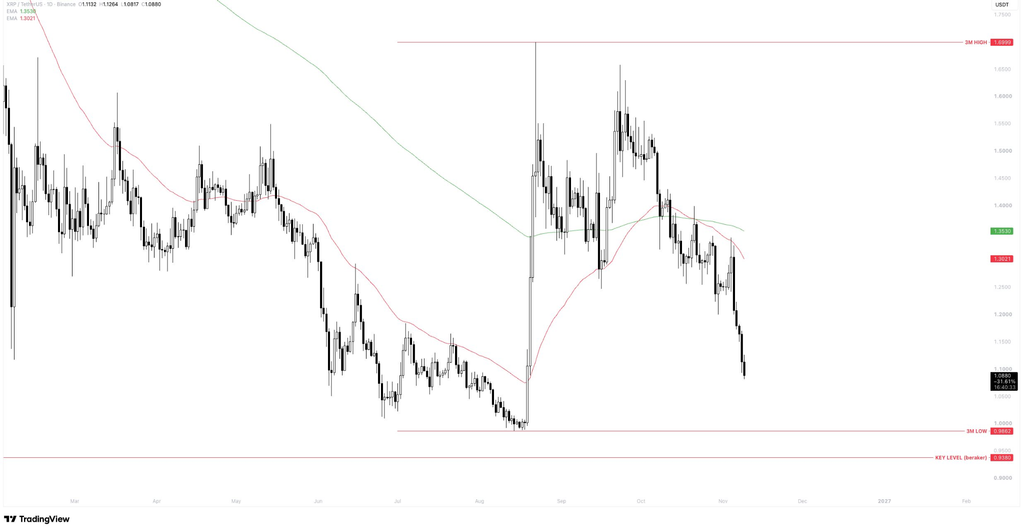
$XRP traded near $1.0880 on its daily chart as a bearish moving-average crossover brought two downside levels into focus: $0.9862 and $0.9380. The 50-day exponential moving average crossed below the 200-day measure, confirming a weakened trend structure after failed recoveries.
Therefore, a daily close below the three-month low at $0.9862 would bring the lower support at $0.9380 into view. TradingView data places the shorter average at $1.3021 and the longer average at $1.3530, both above $XRP.
The 50-day line slopes downward, while the 200-day line remains overhead as a recovery barrier. This price analysis treats the crossover as evidence of an existing decline, not a guarantee of further losses. Generally, exponential averages emphasize recent prices but lag market moves.
Know when your coins move
Alerts, real-time prices, and market news — all in one app
Point your phone camera to install
4.8 based on 40K reviews in the App Store and Google Play
Support Level
Significance
Market Implication
$1.08–$1.10
Immediate support zone
Area to monitor for price stabilization
$0.9862
Three-month low
A daily close below confirms a break of the previous floor.
$0.9380
Deeper key support
Next downside level following a confirmed $0.9862 breakdown
Lower Highs Reinforce $XRP’s Decline Below Both Daily EMAs
The chart shows weaker rebounds after an October recovery stalled around $1.50. Each rally failed to regain earlier highs, while renewed selling carried prices back toward $1.10. That sequence links the bearish crossover with declining rebound peaks.
The displayed candle opened at $1.1132, reached $1.1264, and then fell to $1.0817. Its indicated price of $1.0880 stood below the opening level, although the candle was not necessarily complete. Consequently, the session’s final closing position remained unconfirmed.
Source: TradingView
In this price analysis, the $1.08–$1.10 zone is the first area to watch. A move back above $1.10 would recover that nearby threshold, but it would not erase the lower-high structure. $XRP would still face both moving averages above the market.
Break Below $0.9862 Would Bring $0.9380 Into View
The next major downside reference stands at $0.9862, the three-month low established in August before a recovery. That point is approximately 9.4% below the chart’s displayed $1.0880 level. A daily close beneath it would mark a breach of the earlier floor and put $0.9380 in focus.
The deeper support lies roughly 4.9% below $0.9862 and 13.8% under the displayed price. This price analysis distinguishes the confirmed crossover from a support breakdown that has not occurred.
Meanwhile, the three-month high for $XRP at $1.6999 shows the distance from the upper end of the range. A broader price analysis places recovery hurdles at the 50-day EMA of $1.3021 and the 200-day EMA of $1.3530. Those levels remain above the current trading price.
$XRP Key Resistance Levels
Resistance Level
Significance
Market Implication
$1.10
Immediate recovery threshold
Reclaiming this level would restore the nearby price threshold.
$1.3021
50-day EMA
First major moving-average resistance
$1.3530
200-day EMA
Higher resistance requiring a stronger recovery
$1.50
October rebound area
Previous recovery stalled around this level
Bearish Scenario: A daily close below $0.9862 would take $XRP beneath its three-month low, putting the next support at $0.9380 in focus. From the displayed price of $1.0880, that would represent a decline of approximately 13.8%.
Bullish Scenario:$XRP would need to move back above $1.10 and establish higher lows to show early signs of recovery. However, the broader trend would remain under pressure until the price reclaims the 50-day EMA at $1.3021. A move toward the 200-day EMA at $1.3530 would then become the next test.
Neutral Scenario:$XRP could continue trading between $1.08 and $1.10, with neither buyers nor sellers establishing a clear direction. Without a confirmed breakdown or a sustained recovery, the immediate outlook would remain uncertain, while the bearish EMA crossover stays in place.
$XRP Price FAQs
1. Why Is $XRP Showing Bearish Signals?
The 50-day EMA crossed below the 200-day EMA, while $XRP continues trading beneath both averages.
2. What Is $XRP’s Next Major Support Level?
The three-month low at $0.9862 is the next major support, followed by $0.9380.
3. Could $XRP Decline Toward $0.9380?
A confirmed daily close below $0.9862 would bring the deeper $0.9380 support into focus.
4. What Levels Must $XRP Reclaim for a Recovery?
$XRP faces recovery thresholds at $1.10, $1.3021, and $1.3530, with the latter two marking its moving averages.
Related: BTC Eyes $60K, ETH $1,963, $XRP Below $1? Key Support Levels

 coinedition.com