Pepe Price Prediction November 2026: Will PEPE Break Out in November as Volume Jumps 95%?
coinedition.com
26 m
Pepe price prediction for November stays bullish above $0.00000474, the support $PEPE needs to hold as it presses toward its late-October high.
Pepe Price Analysis: Can $0.00000474 Hold?
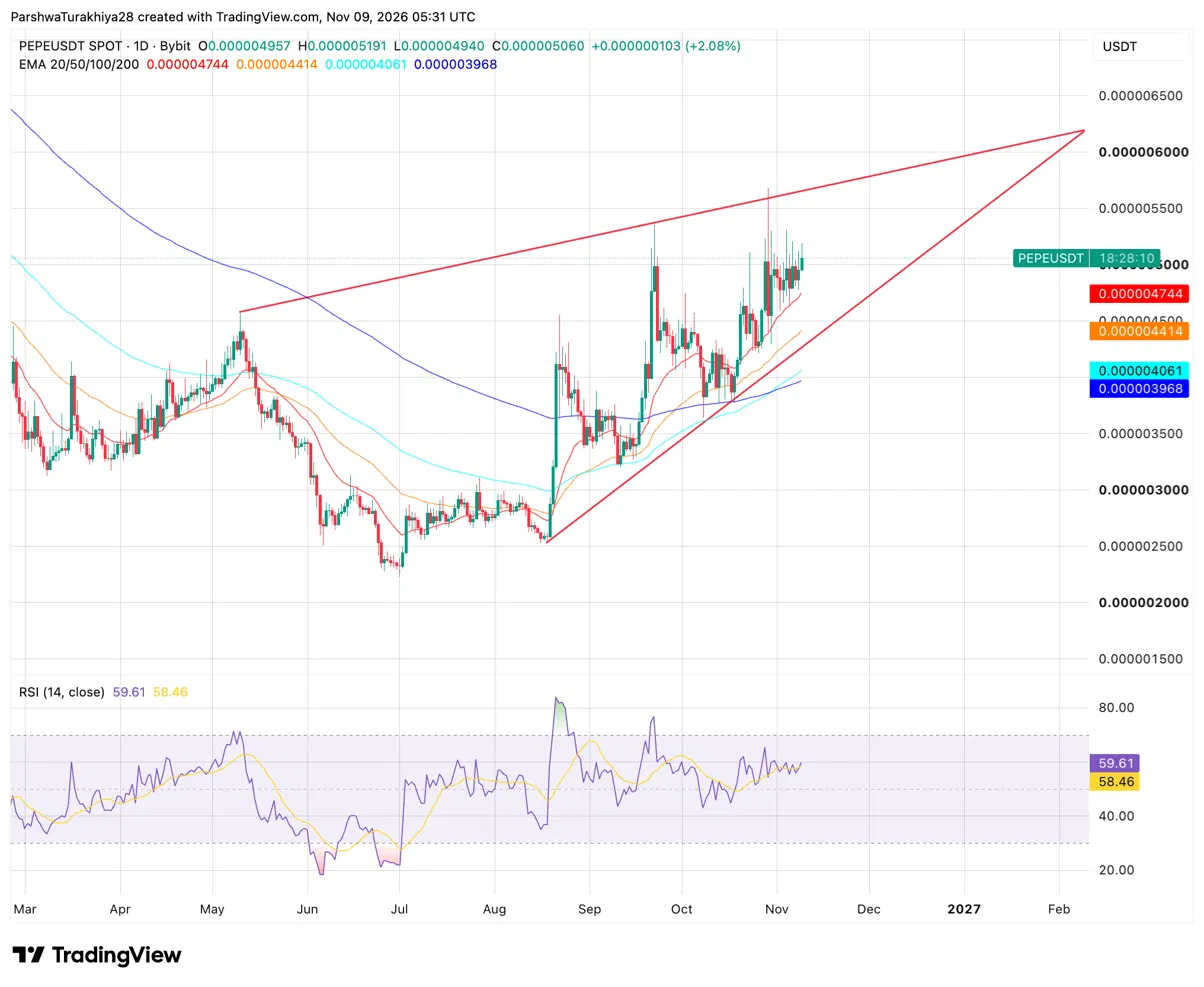
Pepe Price Analysis (Source: TradingView)
$PEPE’s near-term outlook remains bullish while daily closes hold above $0.00000474, its 20-day EMA. The token trades at $0.00000506, up 2% today, and remains above all four major daily moving averages.
Know when your coins move
Alerts, real-time prices, and market news — all in one app
Point your phone camera to install
4.8 based on 40K reviews in the App Store and Google Play
The 50-day EMA at $0.00000441 provides the next support, followed by the 100-day at $0.00000406 and the 200-day at $0.00000397. $PEPE has more than doubled from its late-June low near $0.00000223. Meanwhile, the RSI stands at 59.61, suggesting positive momentum without overbought conditions.
However, the rally has slowed since $PEPE reached $0.00000567 in late October. Price has since moved sideways between roughly $0.00000470 and $0.00000530, as buyers struggle to extend the advance.
Two rising trendlines frame the broader price structure. The upper boundary near $0.00000566 reinforces resistance around the October high. The lower boundary near $0.00000426 provides additional support below the 50-day EMA. Although these lines converge around February, a breakout or breakdown could happen sooner.
Related: Ethereum Price Prediction: ETH Faces Further Downside as Vitalik Buterin Questions Fee Burning
For now, 0.00000474-0.00000536 is the key near-term range to watch. Clearing its upper end would bring $0.00000567 back into focus. A daily close below $0.00000474 would weaken the bullish outlook and expose support at $0.00000441.
$PEPE Support and Resistance Levels, November 2026
Type
Price
Why it matters
Resistance
$0.00000519
Today’s high
Resistance
$0.00000536
September high
Resistance
$0.00000567
Late-October wick high, near the upper line
Support
$0.00000474
20-day EMA
Support
$0.00000441
50-day EMA
Support
$0.00000406
100-day EMA, beside the 200-day at $0.00000397
$PEPE Derivatives: Volume Nearly Doubles, but Open Interest Barely Moves
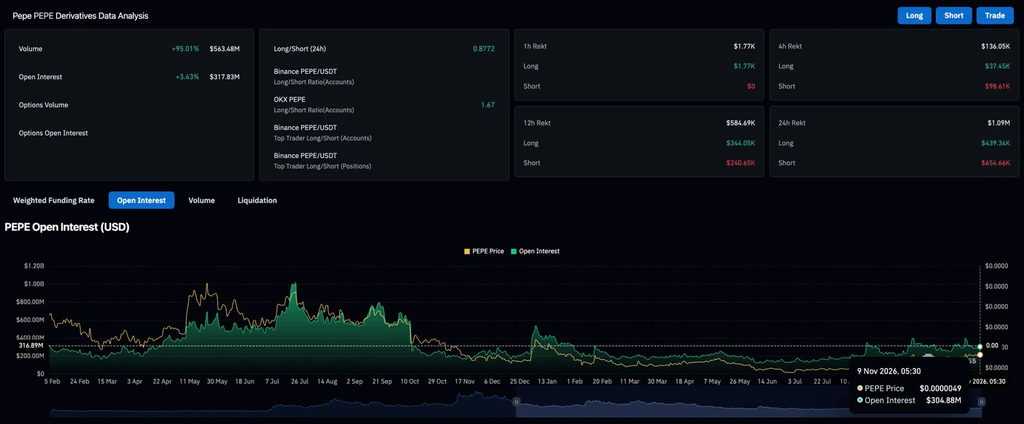
$PEPE Derivatives Data (Source: Coinglass)
$PEPE’s derivatives volume nearly doubled to $563.48 million, but open interest rose just 3.43% to $317.83 million. The gap suggests heavier trading activity without a comparable increase in outstanding positions.
Liquidations totaled $1.09 million over 24 hours, with short sellers accounting for roughly 60% of those losses. The long/short ratio stood at 0.8772, indicating a modest tilt toward bearish positioning.
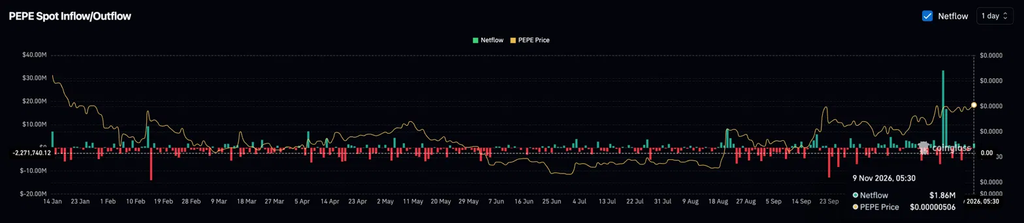
$PEPE Netflows (Source: Coinglass)
Meanwhile, spot exchanges recorded a net inflow of $1.86 million. That was well below the roughly $33 million inflow near $PEPE’s late-October high. Exchange inflows can signal potential selling pressure, although transfers alone do not confirm that holders are selling.
Metric
Value
What it shows
Derivatives volume
$563.48M, up 95.01%
Trading nearly doubled
Open interest
$317.83M, up 3.43%
Little new leverage
24h liquidations
$1.09M, shorts $654.66K
Shorts took about 60%
Long/short ratio (24h)
0.8772
Slightly more shorts than longs
Spot netflow (1 day)
+$1.86M
Small net inflow to exchanges
Zach Humphries Says $PEPE Is Beating Ethereum and Shiba Inu
Zach Humphries, an analyst who said on October 20 that he was going heavy on $PEPE, says the token has risen since early October while Ethereum and Shiba Inu ($SHIB) have fallen. He sees that as a sign $PEPE is attracting its own buyers instead of simply following Ethereum.
Against Ethereum:$PEPE dipped on October 6 and 7 but stayed above its September lows and has climbed since mid-October. Ethereum has been sliding for about 30 days.
Against $SHIB:$SHIB is the next-largest token in its category, at a market value of about $2.61 billion against $PEPE’s $2 billion. It has fallen alongside Ethereum.
Through the selloffs:$PEPE kept rising through the Binance hack and a recent stock-market drop.
The chart agrees that $PEPE has held its structure. But $PEPE is an Ethereum-based token, so another Ethereum selloff is the main risk to the $0.00000474 support.
Pepe Price Prediction Scenarios for November
Bullish Case, Target: $0.00000567
$PEPE holds the 20-day EMA at $0.00000474, closes above today’s high at $0.00000519 and the September high at $0.00000536, then reaches $0.00000567, about 12% above today’s price. A close above it would open the $0.00000600 round level, about 19% higher. A steadier Ethereum would fit this path.
$PEPE closes below the 20-day EMA at $0.00000474 and the 50-day at $0.00000441, about 13% below today’s price. That would put the rising line near $0.00000426 and the 100-day EMA at $0.00000406 in play, about 20% below today’s price. Another Ethereum selloff and rising spot inflows would fit this path.
FAQs
What is the Pepe price prediction for November 2026?
$PEPE stays bullish above $0.00000474 and could move toward $0.00000567 if it closes above today’s high and the September high at $0.00000536. A daily close below $0.00000474 would put $0.00000441 in play.
Why is the Pepe price rising?
$PEPE is up 2% today at $0.00000506 and has more than doubled from its late-June low near $0.00000223. Zach Humphries says it has outperformed Ethereum since early October, but none of the data in this analysis points to a single cause.
What is the key support level for Pepe?
The 20-day EMA at $0.00000474 is the first support, followed by the 50-day EMA at $0.00000441. A close below that would put the $0.00000406 area, where the 100-day EMA sits, in play.
What are $PEPE derivatives showing?
Coinglass shows derivatives volume up 95.01% to $563.48 million and open interest up 3.43% to $317.83 million, so trading rose much faster than new leverage. Shorts took about 60% of the $1.09 million in 24-hour liquidations.

 coinedition.com