A Market Under Pressure
$XRP’s latest decline came as the broader crypto market also faced heavy selling. The total crypto market cap dropped 5.4% in 24 hours to around $2.54 trillion, as Bitcoin fell to $75,551.
Institutional investment products also recorded significant withdrawals, with ETF outflows approaching $530 million. At the same time, total crypto liquidations exceeded $1.08 billion on Thursday, including approximately $954 million in long positions.
The political situation contributed to the bearish sentiment. The U.S. Senate had already failed to advance the CLARITY Act following a narrow vote. With the Democrats now holding a majority in the House, the proposed market structure law faces greater challenges.
This has weakened expectations for regulatory clarity in the near term, leaving investors with more uncertainty about the rules that will govern the crypto industry.
What the $XRP Weekly Chart Shows
$XRP’s weekly chart explains why the current price level is important. After reaching its all-time high of $3.66 in July 2025, the crypto began trading inside a descending channel that guided its price movement for more than a year.
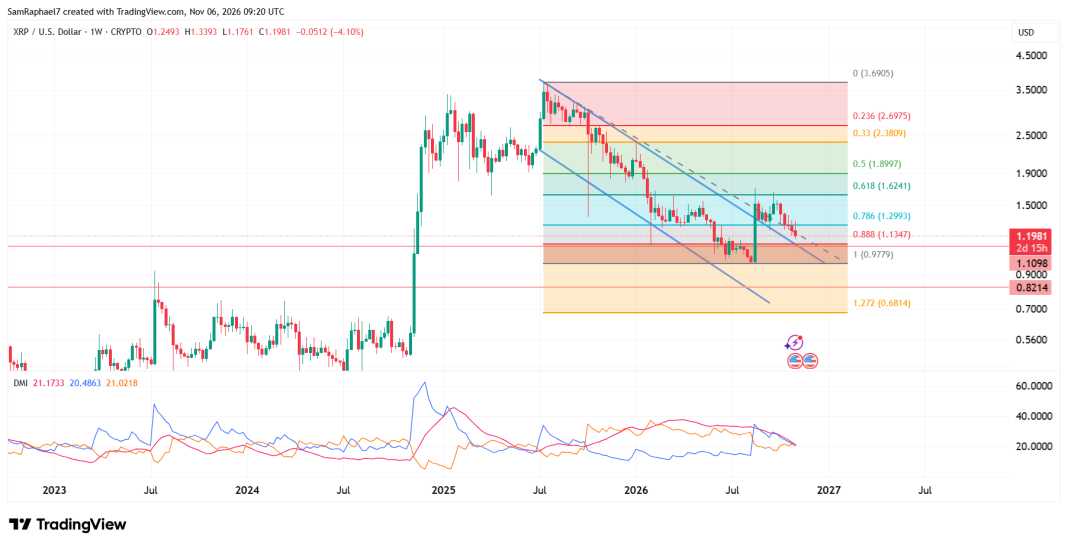
Fibonacci retracement levels drawn from that high show several important price points along the decline. These include $2.6975 at the 0.236 level, $2.3809 at 0.33, $1.8997 at the 0.5 midpoint, $1.6241 at 0.618, and $1.2993 at 0.786. $XRP has already fallen below the $1.2993 level.
The descending channel eventually lost its hold on $XRP’s price in August 2026. During the week ending Aug. 23, $XRP climbed 53% and broke above the channel’s upper trendline.
This move changed the medium-term chart structure and raised the possibility that the asset had finally moved out of its prolonged downtrend.
However, $XRP has struggled to maintain those gains and has since entered another correction. The latest sell-off has now brought its price closer to the same trendline it broke above in August.
The Level That Could End the Current $XRP Pullback
The upper trendline of the former descending channel currently sits at $1.1098. With $XRP trading around $1.1981, the price would need to fall another 7.3% to reach it. This makes $1.1098 an important level for the August breakout.
How $XRP reacts around this area could help determine whether the earlier rally marked a lasting change in its market structure or whether the asset is at risk of falling back into its previous downward channel.
If buyers defend $1.1098, it would confirm that the August breakout remains valid. It could also suggest that the current correction has reached its bottom and give $XRP room to attempt another recovery.
Before the price reaches the trendline, the 0.888 Fibonacci retracement at $1.1347 could provide another layer of support. This level sits just above the trendline and may slow the decline if selling pressure continues.
However, a break below $1.1098 would weaken the bullish outlook and expose $XRP to lower prices. The 1.0 Fibonacci retracement at $0.9779 and the $0.9000 level would become the first major areas to watch below the trendline.
If sellers push the price through both levels, $XRP could fall toward $0.8214, which marks the last significant support within the former descending channel. A further breakdown below $0.8214 would bring the 1.272 Fibonacci extension at $0.6814 into focus as the next downside target.
DMI Shows $XRP Pullback Lacks Enough Strength
The Directional Movement Index (DMI) on $XRP’s weekly chart also shows continued selling pressure. The positive directional indicator, which tracks upward momentum, currently stands at 20.48 and is moving lower.
In contrast, the negative directional indicator has reached 21.02 and continues to rise. This means downward momentum has moved ahead of buying pressure, giving sellers a slight advantage at the moment.
The Average Directional Index (ADX), which measures the strength of a trend, stands at 21.17 and is also declining. This suggests that the current downtrend does not have strong momentum behind it.
As a result, $XRP could still find support around $1.1098 and begin to stabilize. However, the indicators have yet to show a clear change in direction. Until that happens, sellers remain in a stronger position, and the risk of further losses remains.

 thecryptobasic.com