Crypto Price Analysis, BTC, XRP, NEAR, INJ and HYPE, Nov. 6: Bitcoin Holds Its Prior Low, XRP falls as Momentum Weakens, NEAR Breaks Below...
thecryptobasic.com
17 m
Bitcoin holds $75,625 at the close as $NEAR breaks support and Injective gains. November 6 price analysis tracks $BTC, $XRP, $NEAR, $INJ and $HYPE on daily charts.
Asset
Latest USD price
Past 24 hours
24-hour market volume
Market-cap rank
Bitcoin ($BTC)
$75,810
−5.84%
$44.18 billion
1
$XRP
$1.21
−7.75%
$2.31 billion
5
$NEAR Protocol ($NEAR)
$3.69
−8.86%
$608.44 million
21
Injective ($INJ)
$8.36
+3.74%
$175.42 million
81
Hyperliquid ($HYPE)
$77.58
−7.45%
$1.24 billion
11
Bitcoin erases Wednesday’s gain on heavier volume
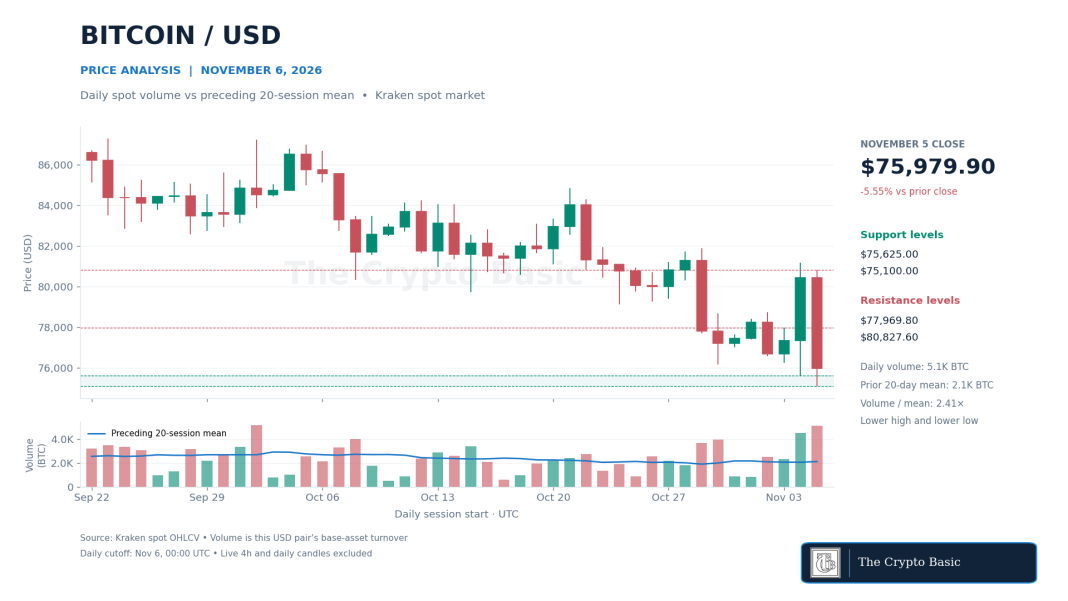
Bitcoin fell 5.55% on Thursday, more than reversing Wednesday’s 4.02% gain. The session high of $80,827.60 fell short of Wednesday’s $81,179.60. By the close, Bitcoin had also lost the $77,969.80 level it had recovered during the rally.
Know when your coins move
Alerts, real-time prices, and market news — all in one app
Point your phone camera to install
4.8 based on 40K reviews in the App Store and Google Play
Bitcoin traded down to $75,100 on 2.41 times its recent average volume but closed back above Wednesday’s $75,625 low.
Thursday’s Bitcoin analysis identified a daily close below $75,625 as the condition that would invalidate Wednesday’s reversal. Sellers pushed Bitcoin $525 beneath that level intraday, setting a 30-session low. They did not keep it there through the close. Friday’s early price of $75,810 left just $185 above that threshold.
Trading was heavier on the decline than on the preceding rally. Approximately 5,103 $BTC changed hands in the spot USD pair, against 4,498 $BTC on Wednesday and an average of about 2,114 $BTC over the preceding 20 sessions. That puts Thursday’s turnover at 2.41 times its recent average.
A daily close above $77,969.80 would be the first sign that buyers can recover lost ground; $80,827.60 would be the next test. A close below $75,625 would meet the earlier downside condition. Below Thursday’s $75,100 low, September 15’s $74,891.50 low is the next nearby reference.
$XRP falls back toward $1.20 as momentum weakens
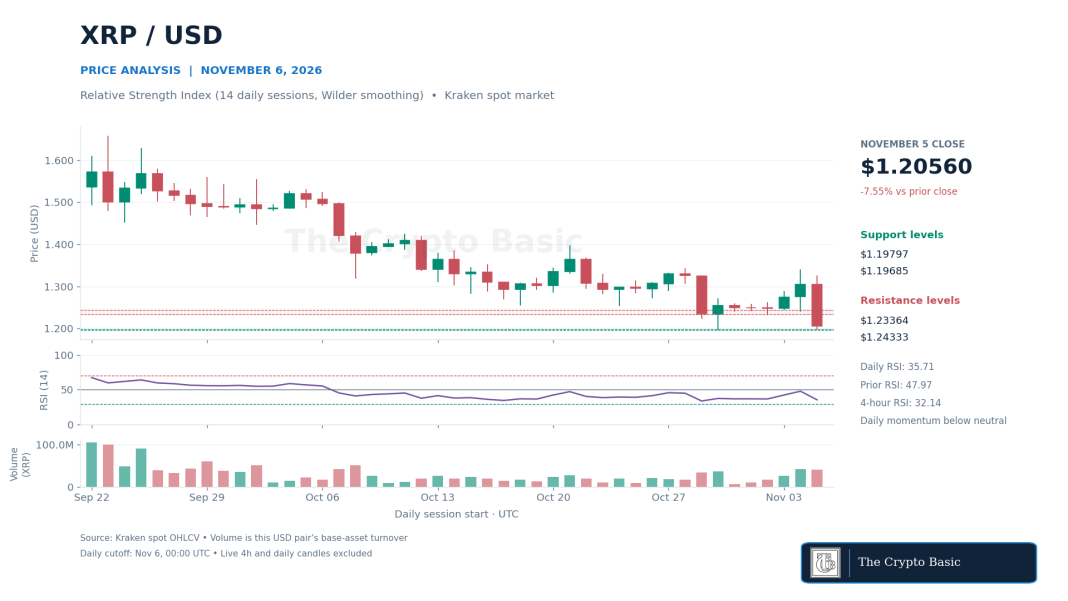
$XRP fell 7.55% on Thursday to close at $1.20560. Its $1.19797 low came within $0.00112 of the October 30 low at $1.19685. The final four-hour candle accounted for the last leg of the decline, opening at $1.24300 and finishing near the day’s low.
$XRP’s daily RSI fell to 35.71 as price tested $1.20; Thursday’s low remained just above the October 30 low of $1.19685.
Wednesday’s $1.30409 close had carried $XRP above the $1.28923 resistance discussed in the November 4 report. Thursday erased that breakout. $XRP finished below both $1.24333 and $1.23364, two levels that had supported it earlier in the week. The October floor is now the more consequential test.
The 14-day Relative Strength Index, calculated using Wilder smoothing, fell from 47.97 to 35.71. Four-hour RSI finished lower still at 32.14. Both readings show that losses have outweighed gains, though neither had crossed the conventional oversold threshold of 30.
A recovery above $1.23364 would reclaim Monday’s low. A daily close above $1.24333 would give buyers a better chance of retesting $1.27214. In the other direction, a daily close below $1.19685 would confirm a break of the October floor that Thursday’s selloff narrowly avoided.
$NEAR closes below Wednesday’s low but inside its lower band
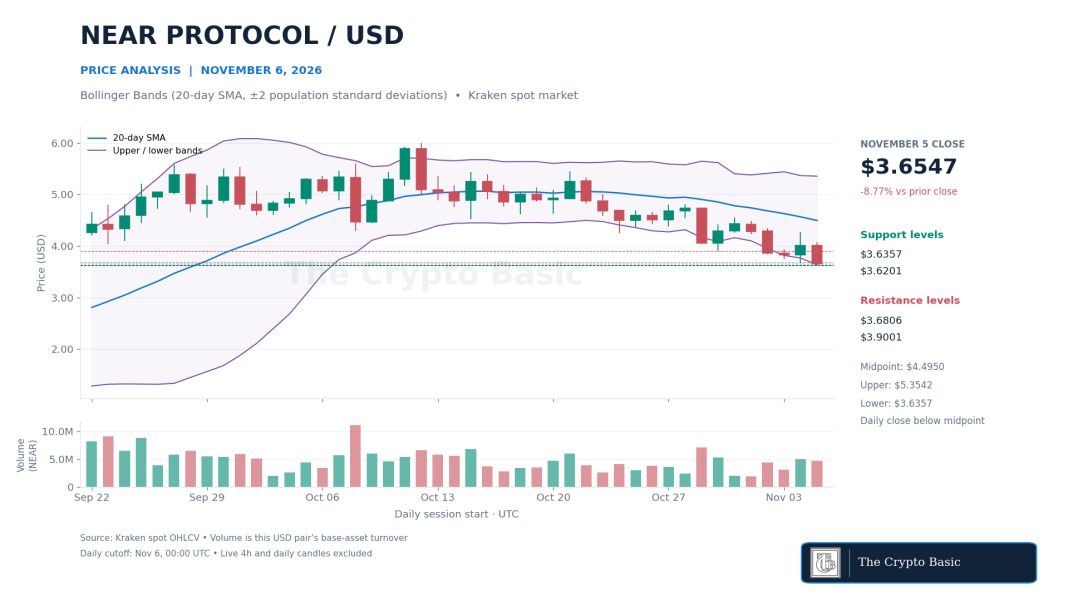
$NEAR gave back Wednesday’s recovery in a single session. It fell 8.77% to $3.6547 after trading between $3.6201 and $4.0741. The close below $3.6806 invalidated the prior day’s reversal. Friday’s early price of $3.69 was back above that level, but the new daily session had not closed.
$NEAR closed below Wednesday’s $3.6806 low but above its $3.6357 lower Bollinger Band after a brief move beneath it.
$NEAR’s Bollinger Bands show how close it came to a second breakdown signal. Using a 20-day simple moving average and two population standard deviations, the lower band stood at $3.6357 at Thursday’s close. Price traded below that value intraday but finished just inside the band. The break of Wednesday’s price support was confirmed; a daily close outside the band was not.
The midpoint also fell, from $4.5653 to $4.4950, as Thursday marked a fresh 30-session low. A daily close back above $3.6806 would repair the first break, but the stronger test is $3.9001, the October 30 low that buyers briefly recovered on Wednesday. Above it, Thursday’s $4.0741 high stands in the way. A close below $3.6201 would extend the decline and invalidate Friday’s early attempt to regain support.
Injective clears $8.079 as both daily averages rise
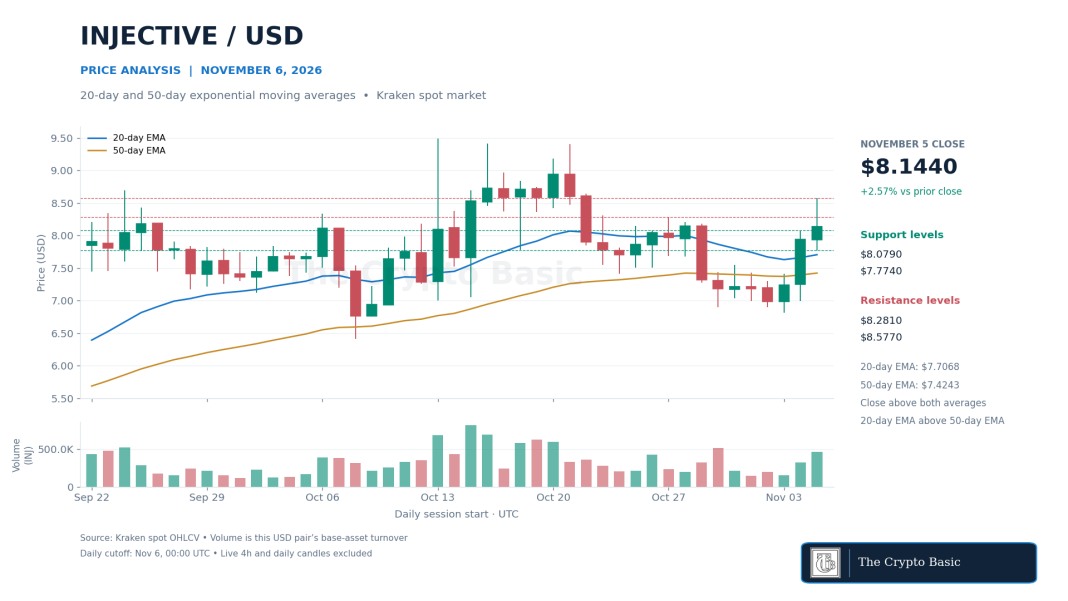
Injective posted a third consecutive daily gain, closing Thursday at $8.144, up 2.57%. Its $7.774 low held above Wednesday’s $6.998 low, and its close exceeded Wednesday’s $8.079 high. The advance reached $8.577 before retreating, leaving the October 27 high of $8.281 unclaimed at the daily close.
$INJ closed above Wednesday’s $8.079 high and both rising daily averages, but its move through $8.281 did not hold through Thursday’s close.
The 20-day exponential moving average rose to $7.707 from $7.661, while the 50-day EMA rose to $7.424 from $7.395. The faster average was already above the slower one. Thursday’s improvement came from price clearing the previous high and holding above both rising averages, rather than from a new crossover.
At $8.36 early Friday, $INJ had moved back above $8.281. A daily close there would confirm the move that buyers could not sustain Thursday. A subsequent close above $8.577 would bring September’s $8.695 swing high into view. A close back below $8.079 would surrender the breakout; loss of Thursday’s $7.774 low would put the rising 20-day average to the test.
Hyperliquid loses $78.08 as its daily trading range widens
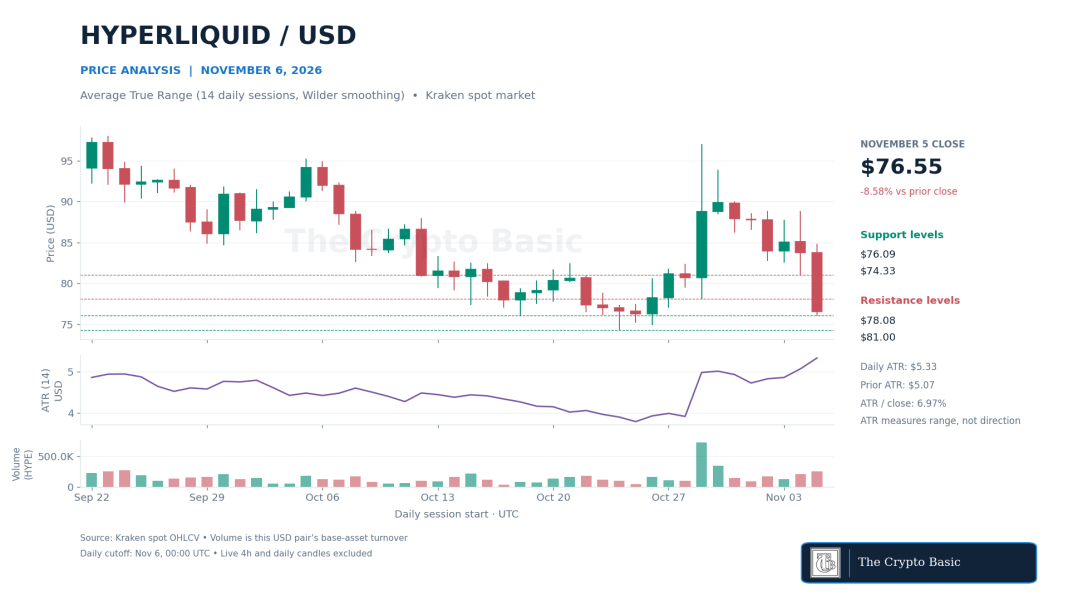
$HYPE closed Thursday at $76.55, down 8.58%. It fell through Wednesday’s $81.00 low and finished below $78.08, the low of the October 29 session when $HYPE rallied as high as $97. Friday’s early recovery to $77.58 had yet to regain even the bottom of that range.
$HYPE closed near the bottom of an $8.75 session range as 14-day average true range rose to $5.33; October support at $74.33 remains intact.
Thursday’s $76.09–$84.84 range spanned $8.75, compared with a 14-day average true range of $5.07 entering the session. Wilder’s average true range rose to $5.33 by the close. The indicator measures the size of moves in either direction. Here, the close just $0.46 above the low shows which side controlled the expanded range.
A daily close back above $78.08 would recover the first broken support. Regaining $81.00 would carry more weight because it would put $HYPE back inside Wednesday’s range, with Thursday’s $84.84 high the next hurdle. A close below $76.09 would instead expose the October 24 low at $74.33. Losing that level would extend the decline beyond the lowest price of the last 30 completed sessions.

 thecryptobasic.com