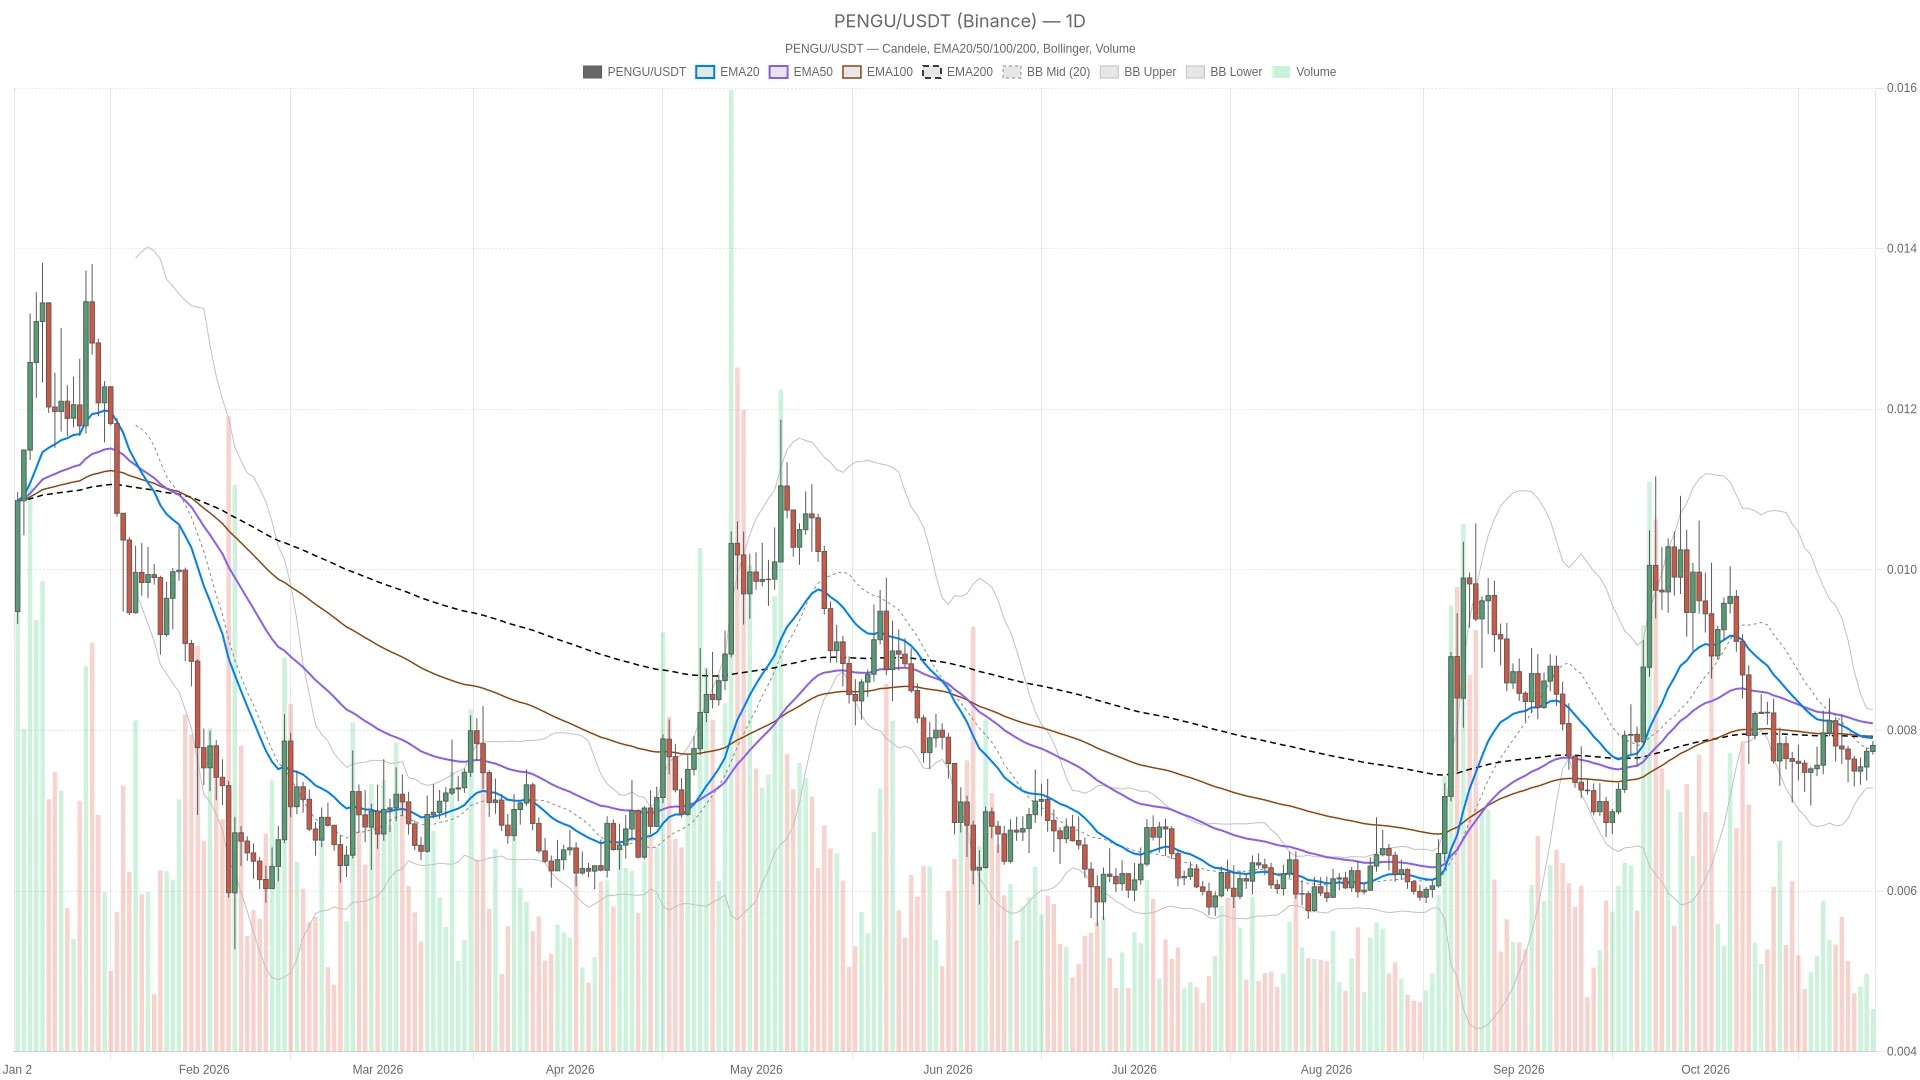
Pengu price scenarios hinge on hourly resistance and support
The near-term direction depends on whether an hourly candle closes above the upper Bollinger Band at $0.007851 or below hourly S1 at $0.007786. The hourly pivot at $0.007820 sits just above the live price. The last completed hourly candle finished at $0.007823. A close above that pivot has already occurred, though the current reading shows price back below it.
Bullish scenario: an hourly close above the hourly Bollinger upper band at $0.007851 would strengthen the continuation case. The next barriers are hourly R1 at $0.007858 and daily R1 at $0.007893. An hourly close back below the hourly pivot at $0.007820 would invalidate that breakout setup. Even a successful intraday advance would still face the daily moving-average ceiling.
Bearish scenario: an hourly close below hourly S1 at $0.007786 would weaken the recovery structure, exposing the daily Bollinger midpoint at $0.007778 and then the hourly Bollinger midpoint at $0.007760. An hourly close back above the hourly pivot would invalidate that breakdown setup. The daily pivot at $0.007634 is a deeper support reference, not the immediate downside test.
The likeliest false signal is a brief push above the hourly pivot that fails before reaching the upper hourly band. Conversely, a temporary loss of hourly S1 would not by itself establish a daily downtrend. These nearby boundaries make completed candles more useful than momentary crossings, especially while the larger chart remains neutral.
RSI improves on the daily chart, but MACD confirmation is uneven
Daily RSI at 45.0 shows recovery underway without establishing bullish control, while the hourly MACD histogram remains slightly negative despite the bullish moving-average structure. Hourly RSI stands at 64.7, with its supplied trend classified as falling, leaving stronger short-term momentum alongside some loss of intensity.
RSI supports recovery without establishing daily control
The 15-minute RSI is 56.4, with a flat trend. For execution context, that is positive but not forceful enough to resolve the disagreement between a neutral daily chart and a bullish hourly structure. None of these readings is overbought or oversold.
Daily MACD histogram turns positive while the hourly histogram remains negative
The daily MACD histogram has crossed from negative to positive across the completed readings, although the MACD line remains below zero. This supports an early recovery reading rather than a mature bullish trend. The hourly histogram is slightly negative despite the bullish hourly moving-average alignment, so short-term momentum does not fully confirm price structure.
On the 15-minute chart, the histogram is positive and its supplied trend is flat. That keeps the smallest timeframe constructive, but it offers no evidence of accelerating momentum. For $PENGU, the stronger signal would be resistance clearance backed by hourly confirmation, rather than the daily histogram crossover alone.
Daily averages cap the recovery while volatility leaves room for reversals
Daily EMA20 at $0.007913, EMA200 at $0.007920, and EMA50 at $0.008099 all sit above price, forming an overhead obstacle that caps the recovery. Those averages are not aligned. The nearby EMA20 and EMA200 form a barrier beyond daily R1, while the higher EMA50 makes a broader bullish reversal harder to establish.
Both the hourly and 15-minute prices are above their respective EMA20, EMA50, and EMA200, and both sets of averages have bullish alignment. This is the central timeframe tension: the lower charts support continuation, while the daily chart still treats the advance as a recovery beneath resistance.
The daily Bollinger envelope runs from $0.007284 at the lower band to $0.008272 at the upper band. Price is above its daily midpoint but below the daily averages, a configuration more consistent with mean reversion inside a range than an established breakout.
Daily ATR is $0.0005737, compared with hourly ATR of $0.00007345 and 15-minute ATR of $0.00003167. The broader volatility allowance is substantial relative to the nearby hourly barriers. Clearing one intraday level would not, on its own, settle the daily direction.
Recent technical coverage also centers on daily neutrality
Technical updates from October 22 and October 23, 2026, described a neutral daily bias consistent with the current reading. That context fits the present technical picture but does not establish a separate event-driven catalyst for this move.
Neutral sentiment offers no strong directional confirmation
The Fear & Greed Index at 51 (Neutral) and Bitcoin dominance at 59.46% provide no directional edge for $PENGU’s immediate setup. CoinGecko places total crypto market capitalization at $2.74 trillion. These backdrop readings do not resolve the timeframe conflict; the asset’s own resistance and support tests remain the more direct evidence.
FAQ
Does the bullish hourly structure make the daily outlook bullish?
No. The daily assessment remains neutral because price is beneath all three daily averages, despite improving daily momentum.
Is the quoted $PENGU price a completed candle close?
No. It is the live reading of an open candle. The scenario triggers depend on completed hourly candles, not a brief move through a level.
Disclaimer: This article is for informational purposes only and does not constitute financial advice, an investment recommendation, or a solicitation to buy or sell any financial instrument or cryptocurrency. The analysis provided is not indicative of future results. Investing in crypto assets and financial markets carries a high risk of capital loss. Always do your own research (DYOR) and consult a qualified financial advisor before making any decision.
Article produced with the assistance of artificial intelligence and reviewed by the editorial team.

 en.cryptonomist.ch