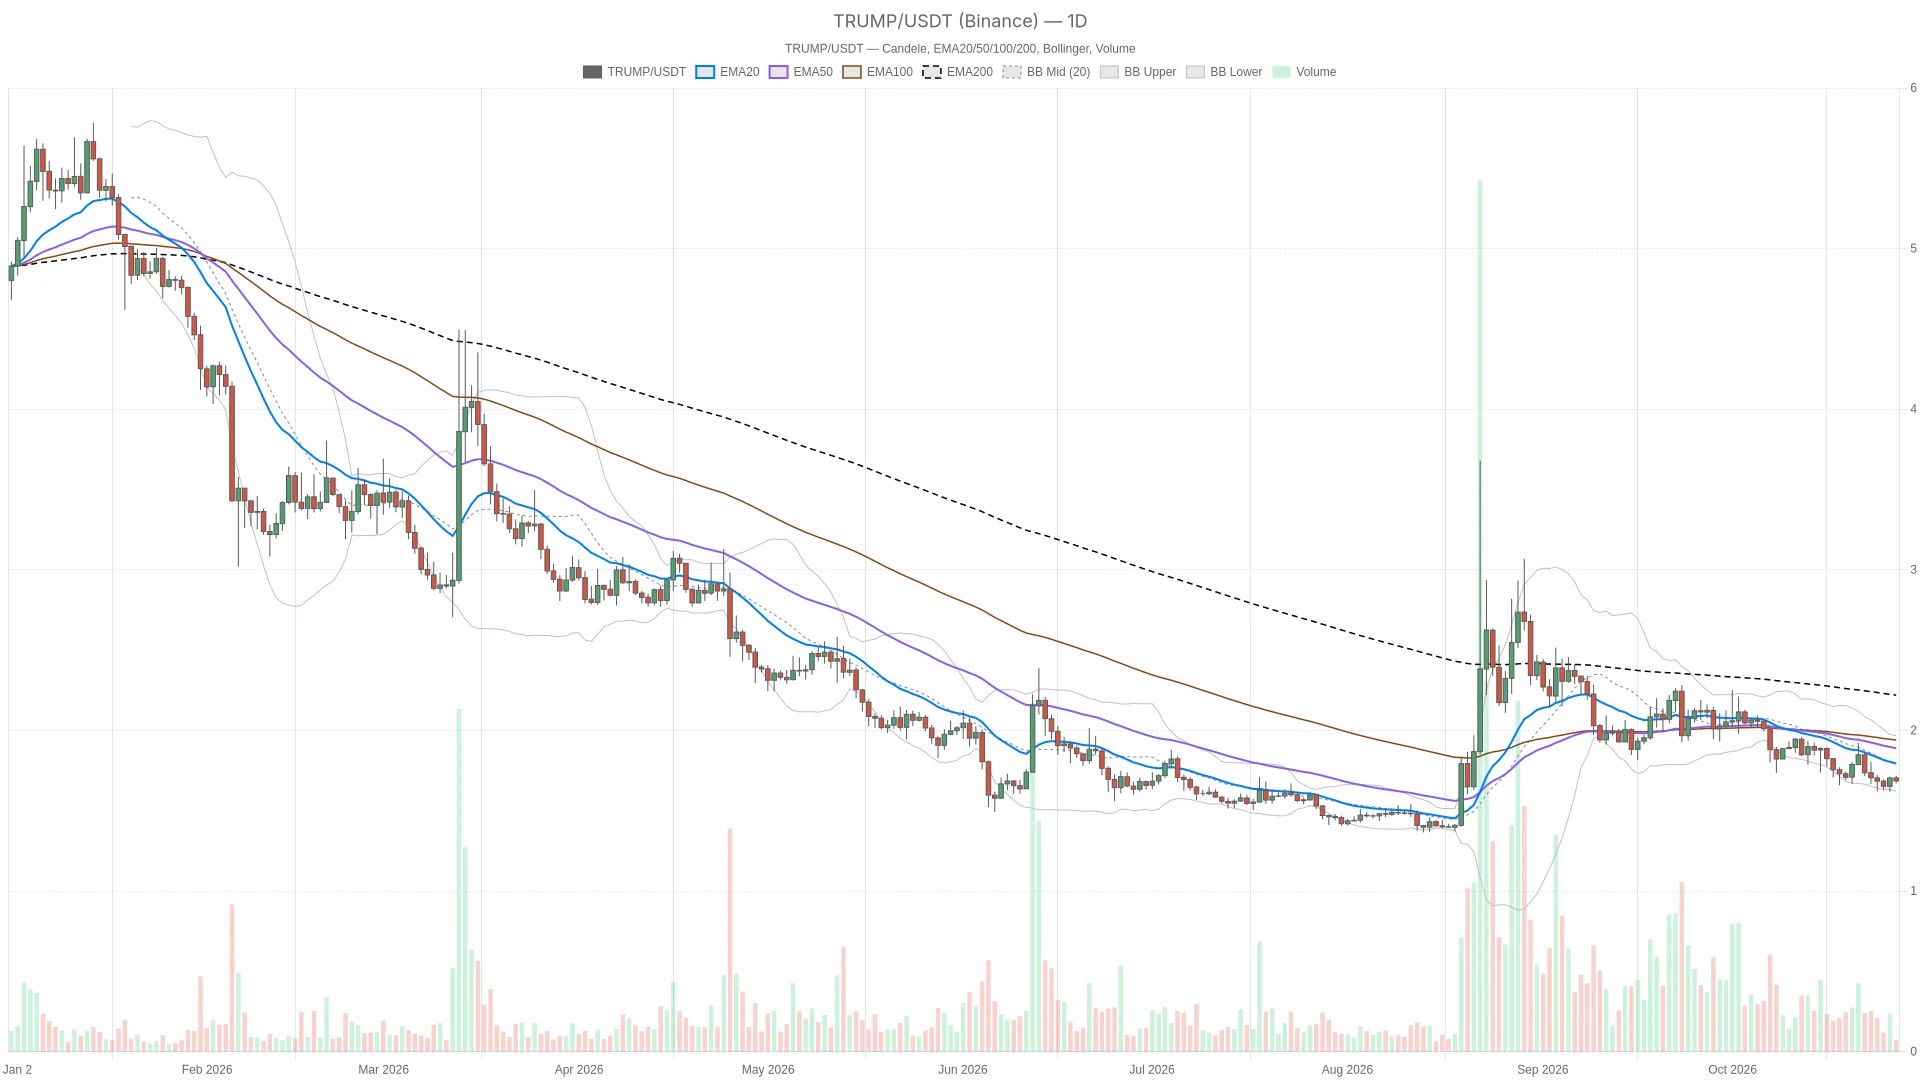
Meanwhile, the immediate tension is between easing daily selling momentum and an hourly chart that is not confirming sustained strength. The dominant force is still the downtrend; the recovery signals describe a possible rebound within it. That makes the nearby daily pivot important: holding above it preserves the rebound case, but does not by itself establish a bullish trend.
Neutral sentiment offers no clear counterweight to the bearish structure
Sentiment indicators show no bullish tailwind for $TRUMP, leaving the bearish daily structure as the primary guide. CoinGecko places total cryptocurrency market capitalization at $2.69 trillion and Bitcoin dominance at 59.43%. These are broader market reference points, not evidence of capital moving into $TRUMP.
In this setting, Alternative.me’s Fear & Greed Index stands at 48, classified as Neutral. Sentiment provides no strong directional confirmation for the token, leaving its own price structure as the more useful guide.
Trump price remains below a bearish daily EMA stack
The daily exponential moving averages confirm the bearish structure, with $TRUMP trading below all three. Binance candle data show price below the daily EMA20 at $1.80, EMA50 at $1.90 and EMA200 at $2.22. Those averages are aligned bearishly, so any rebound would encounter overhead barriers before it could credibly challenge the broader downtrend.
The hourly picture is less decisive. Price is below the hourly EMA20 and EMA200 but above the EMA50; the averages are not aligned. This is a neutral interruption of the daily bearish bias, rather than confirmation that it has reversed.
On the 15-minute chart, price is below the EMA20 and EMA50 but above the EMA200, with the averages also unaligned. For execution context, that places the short-term recovery between nearby overhead pressure and a longer-average foothold. It does not override the daily structure.
Daily momentum improves, but hourly MACD weakens
Daily momentum indicators show easing bearish pressure, yet the improvement is not confirmed on lower timeframes. Daily RSI is rising and stands at 40.1, while the negative daily MACD histogram is narrowing. Downside momentum is easing, but RSI remains below the midpoint and MACD has not turned positive. The distinction matters: weaker bearish momentum is not yet bullish control.
Hourly RSI is 51.4, offering little directional conviction. Moreover, its MACD histogram has crossed below zero and is falling, weakening the case for immediate follow-through. The 15-minute histogram has crossed into positive territory and RSI is rising to 48.4. However, that short-term improvement conflicts with the hourly deterioration and remains insufficient to confirm a broader turn.
The daily Bollinger Bands place the lower boundary at $1.63, the midpoint at $1.80 and the upper boundary at $1.97. Price remains in the lower half of that envelope, so a move toward the midpoint would initially fit a mean-reversion rebound rather than a completed trend reversal.
Furthermore, daily ATR is $0.1224, compared with hourly ATR of $0.01803. The daily volatility measure is substantial relative to the nearby pivot levels, making a brief move through a threshold less persuasive than a completed candle beyond it.
Daily pivot support separates rebound potential from renewed downside
The daily pivot at $1.68 is the critical threshold that separates the rebound scenario from a continuation of the bearish trend. The nearest daily support is the daily pivot at $1.68; the nearest daily resistance is daily R1 at $1.74. Intraday, the hourly pivot at $1.68 sits below price, while the hourly EMA20 is the nearest overhead barrier. The hourly pivot and daily pivot are distinct levels despite displaying the same rounded price.
Bullish scenario: a daily close above daily R1 at $1.74 would confirm a rebound through the nearest daily resistance. The next reference points would be the daily Bollinger midpoint and daily EMA20, both displayed at $1.80 after rounding. A subsequent daily close below the daily pivot at $1.68 would invalidate that bullish scenario.
Bearish scenario: a daily close below the daily pivot at $1.68 would reinforce the dominant bearish bias, exposing daily S1 at $1.64 and then the daily Bollinger lower band at $1.63. A daily close above daily R1 at $1.74 would invalidate that downside scenario.
The likeliest false signal in this setup is an intraday upside break mistaken for a daily reversal. Positive 15-minute momentum is already at odds with a weakening hourly MACD, while daily volatility leaves room for moves through nearby levels without durable follow-through.
FAQ
Is the quoted $TRUMP price a completed daily close?
No. The $1.69 quote is a live Binance candle price, not a completed daily close. The scenarios depend on completed daily candles.
Does improving daily momentum make the outlook bullish?
Not on its own. Daily RSI is improving and the negative MACD histogram is narrowing, but price remains below all three bearishly aligned daily EMAs.
Disclaimer: This article is for informational purposes only and does not constitute financial advice, an investment recommendation, or a solicitation to buy or sell any financial instrument or cryptocurrency. The analysis provided is not indicative of future results. Investing in crypto assets and financial markets carries a high risk of capital loss. Always do your own research (DYOR) and consult a qualified financial advisor before making any decision.
Article produced with the assistance of artificial intelligence and reviewed by the editorial team.

 en.cryptonomist.ch