That means part of the 119.6% gain is a jump from a very low base, not a new trend. Still, the move matters. Payment volume shows how much $XRP is actually moving between accounts, so it is a cleaner signal than exchange trading alone. When this figure rises, more people are sending, settling, and using the network. After weeks of falling activity, any recovery is a good sign.
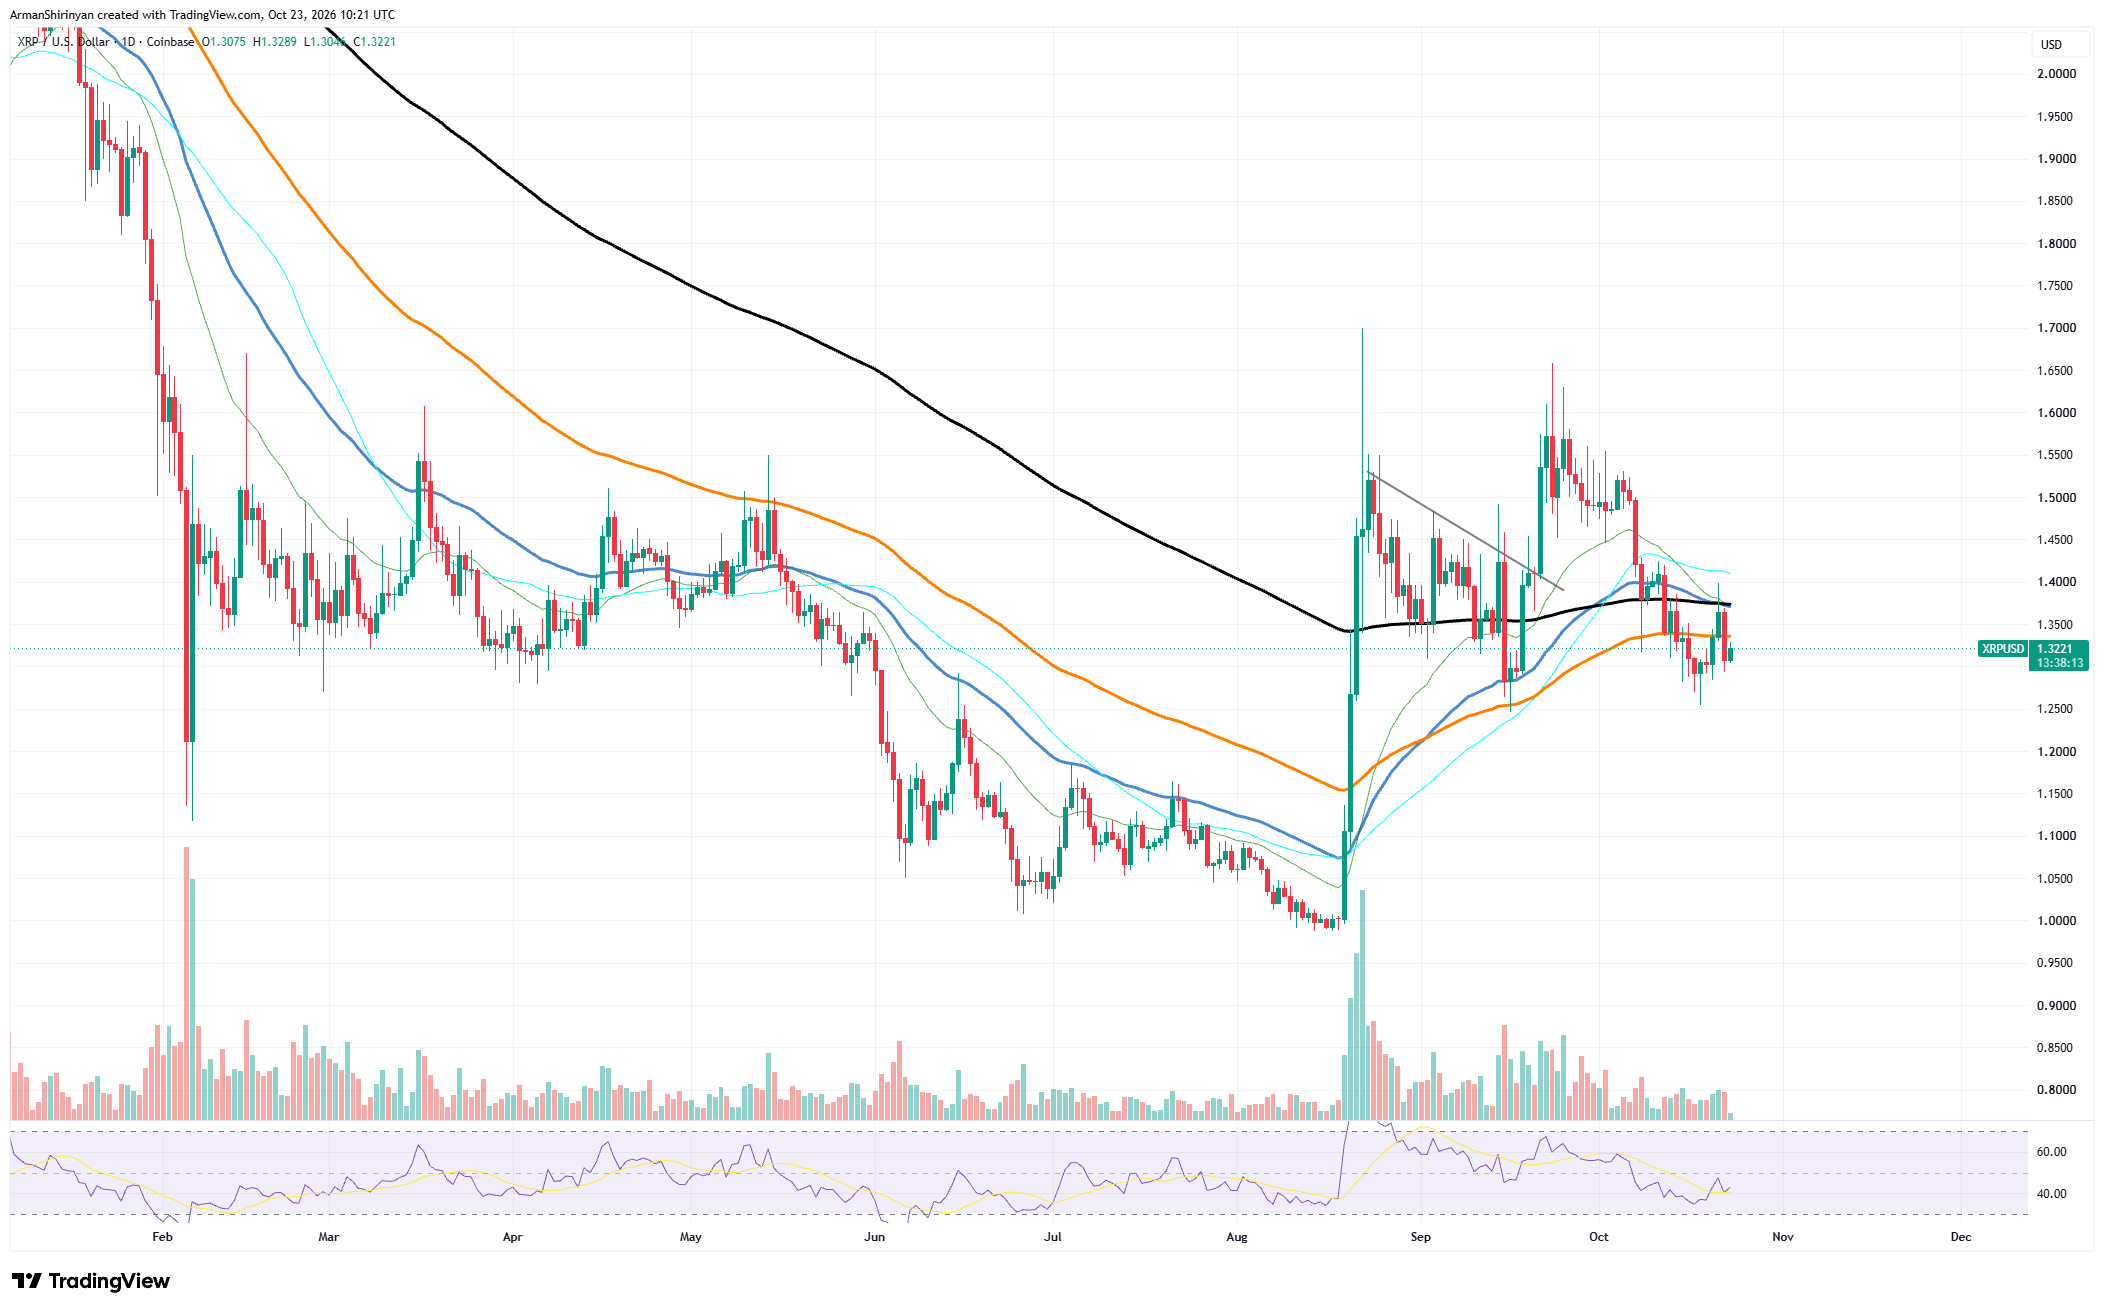
The price chart tells a different story for now. $XRP trades near $1.31 and is below several key moving averages. The 200-day average near $1.37 and the 100-day average near $1.34 are now acting as resistance. The price was rejected at this area earlier in the week, and sellers pushed it back toward $1.27 to $1.30. The RSI sits around 40, which shows weak momentum without being oversold.
What are the next targets?
The recent low near $1.25 is the first level to hold. If it breaks, the next stop is around $1.15, where the price started its August rally. On the upside, a daily close above $1.37 would turn the trend back in favor of buyers. After that, $1.45 and $1.55 become the next targets.
Volume on the price chart is also fading, which means that investors are waiting. A real recovery needs both better network use and stronger buying on the exchanges. So far, only the first part has appeared.
The key point is simple. The ledger is active again, but the price has not reacted yet. If payment volume remains above the 30-day average of 601.9 million $XRP over the next few days, the case for a breakout above $1.37 becomes much stronger. If the spike fades, $XRP will likely stay stuck in its current range.

 u.today