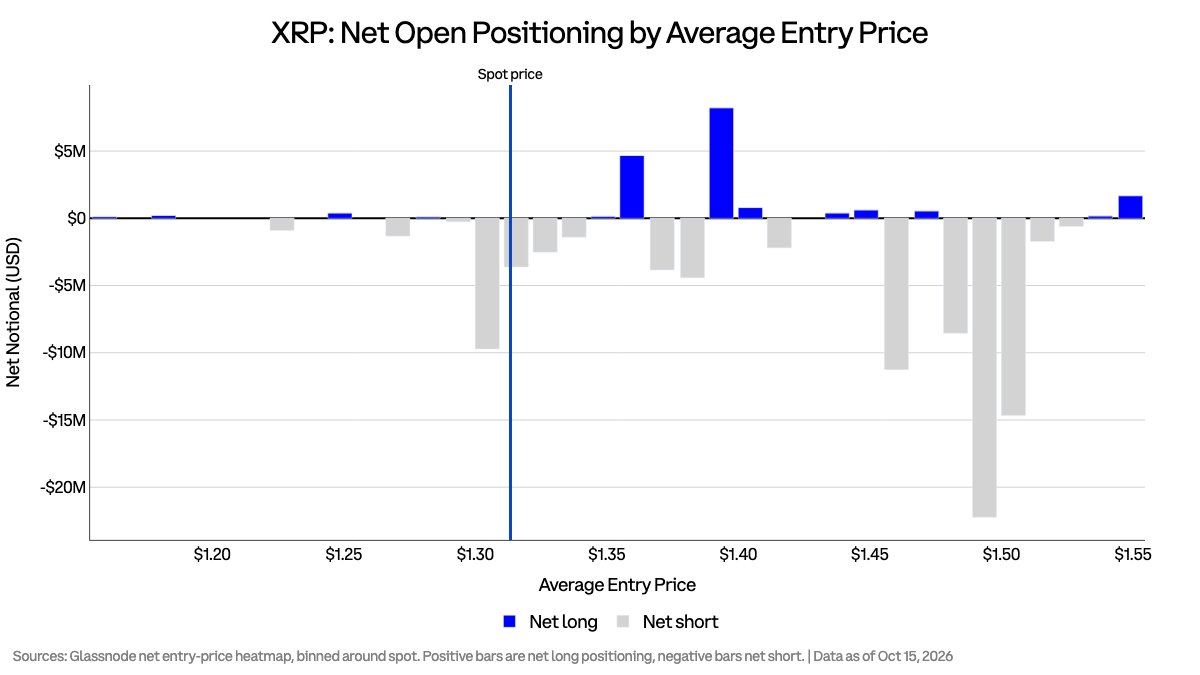
97% of Tracked XRP Net-Long Exposure Was Entered Above Spot Price
thecryptobasic.com
5 h
About 97% of tracked $XRP net-long exposure was entered above spot, with the largest bullish positioning cluster sitting around the $1.40 region.
$XRP’s positioning map shows an unusual imbalance around current prices: roughly 97% of the tracked net-long exposure was opened above the $1.31 spot level used in the snapshot.
That leaves most of the bullish side of the distribution carrying higher entry prices as $XRP trades below the levels where those positions were established.
Know when your coins move
Alerts, real-time prices, and market news — all in one app
Point your phone camera to install
4.8 based on 40K reviews in the App Store and Google Play
Coinbase Markets highlighted the distribution using Glassnode’s net entry-price data, which groups open positioning according to average entry price.
Positive blue bars represent net-long notional, while negative gray bars represent net-short positioning.
$XRP entry-price distribution shows roughly 97% of tracked net-long exposure above the $1.31 spot reference, with the largest long cluster around $1.39-$1.40. Heavy net-short positioning is concentrated near $1.49-$1.50. Source: Coinbase Markets/Glassnode.
$XRP remains close to the snapshot level, trading around $1.33 today.
Most Tracked $XRP Long Exposure Sits Above Spot
The striking feature is not simply that longs exist above the current price. It is how heavily they are concentrated there.
Only a small portion of the positive net positioning appears at or below the $1.31 spot reference.
Most of the blue bars sit between roughly $1.35 and $1.55, meaning those entry-price groups were above water only when $XRP traded at higher levels.
The 97% figure should not be read as saying 97% of every $XRP long position in the market is losing money.
The chart measures tracked net-long notional after long and short exposure has been netted within each entry-price bucket.
That distinction matters when interpreting the data.
$1.40 Holds the Largest Long Concentration
The most important bullish cluster appears around the $1.39-$1.40 region, where the chart shows its largest positive bar.
This makes the area worth watching if $XRP rebounds.
Traders positioned there face several choices. Some could add exposure at lower prices, potentially contributing fresh demand.
Others could use a recovery toward their entry price to reduce or close positions after spending time underwater.
The data does not tell us which response will dominate.
That means $1.40 should not automatically be labeled confirmed resistance simply because many longs entered there. What matters is how those positions behave if price returns to the area.
A sustained move through $1.40 would also bring $XRP closer to other smaller long clusters around $1.44-$1.47.
Heavy $XRP Shorts Sit Near $1.49-$1.50
The other side of the chart is just as important.
Substantial net-short exposure appears at higher entry prices, with particularly large negative bars clustered around $1.48-$1.51. The deepest short bar on the graphic sits close to $1.49, representing more than $20 million in net notional.
Those positions are currently better placed than the longs because $XRP remains below their average entry prices.
But they could also become relevant during a stronger recovery. If $XRP moves back toward $1.50, short holders would have to decide whether to maintain exposure, add to positions or close trades.
Short covering, if it occurred in size, could add buying pressure. Again, the distribution alone cannot establish that such covering will happen.
Positioning Makes the Next Rebound More Important
The chart therefore shows two layers above $XRP.
First comes the large net-long concentration around $1.40. Beyond that sits a much heavier block of net-short positioning around $1.49-$1.50.
How $XRP trades through those areas could reveal whether the market is absorbing underwater long exposure or encountering renewed selling.
For now, the clearest takeaway is narrower: almost all tracked net-long exposure in this distribution was entered above the $1.31 snapshot price, while the largest concentration sits near $1.40. That makes any rebound through the mid-$1.30s an important test of how existing positioning responds.

 thecryptobasic.com