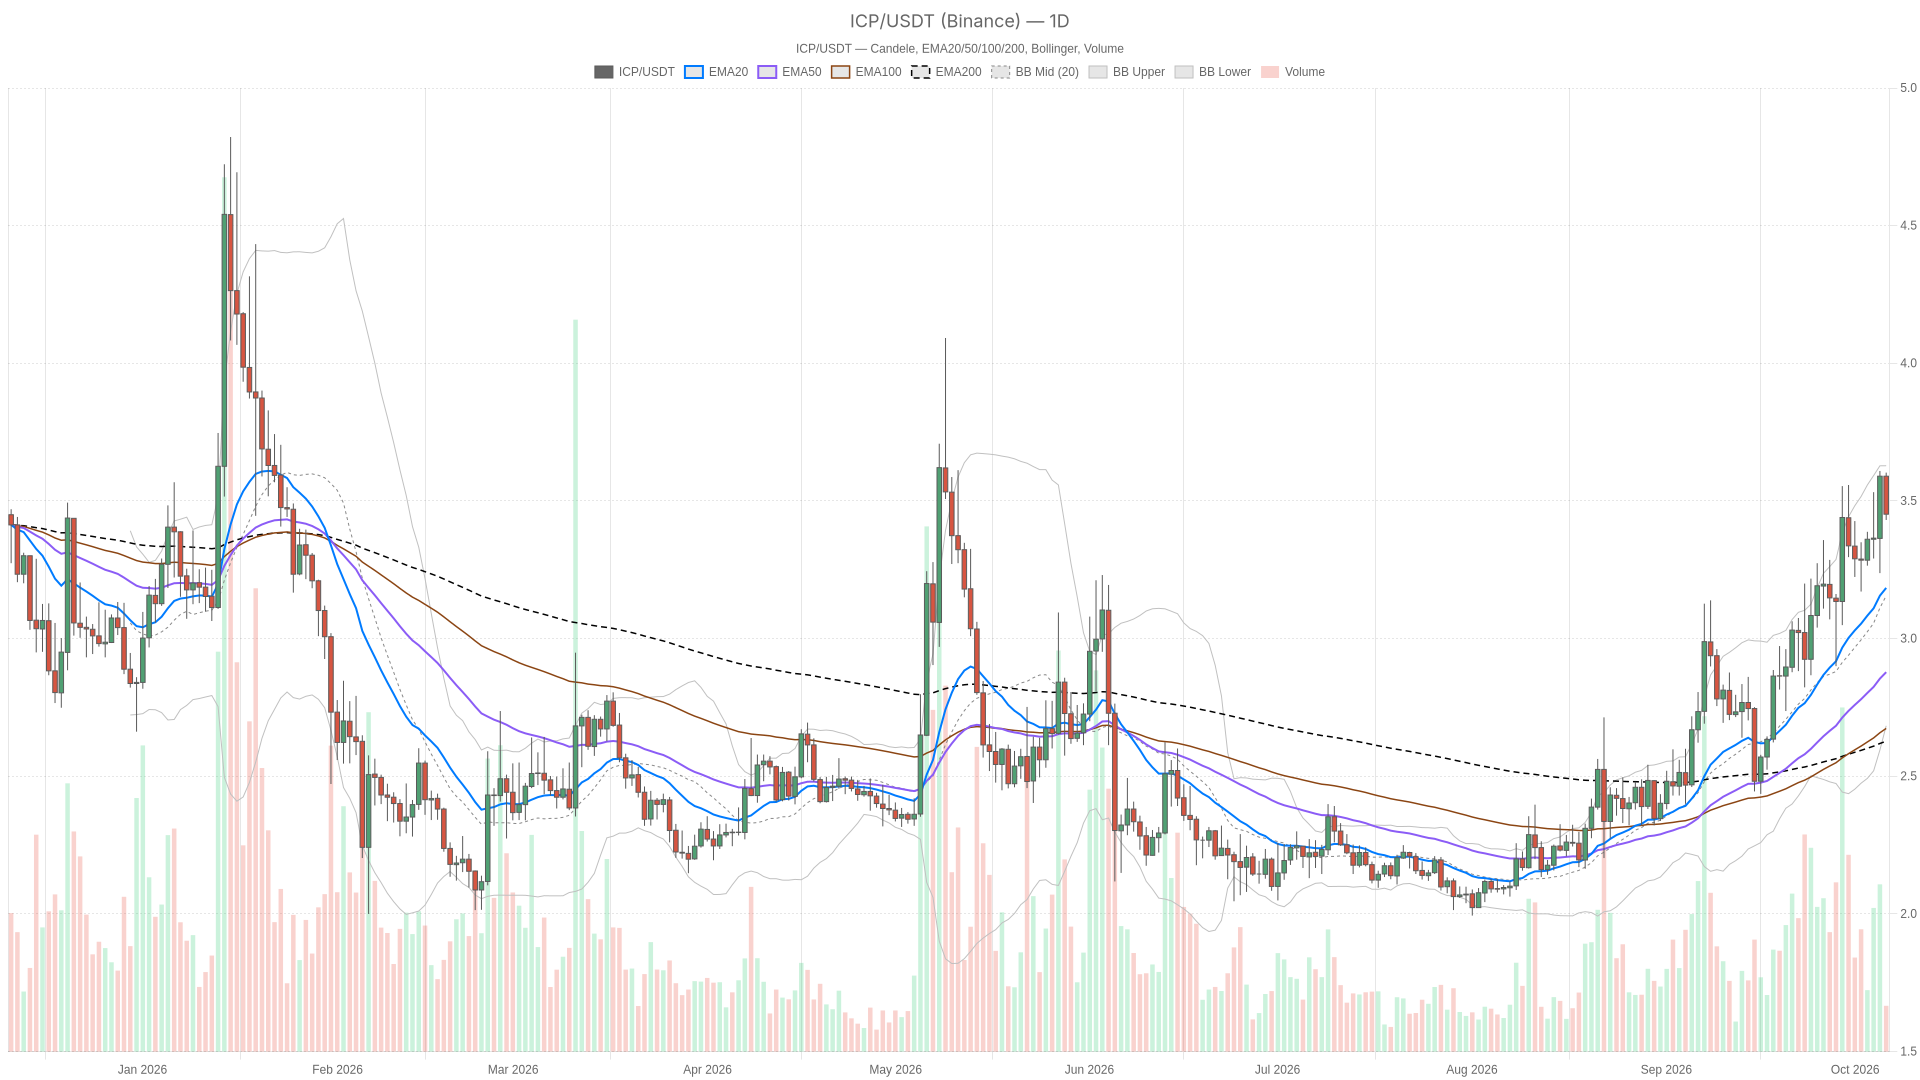
The dominant force right now is a daily uptrend that remains technically intact but has lost its most recent thrust. $ICP is above all three daily EMAs and the daily regime reads outright bullish, yet the live price has already dropped under the daily pivot that capped the last completed session. That is the core tension driving this analysis: is this a routine pause inside a larger uptrend, or the first sign that the overbought stretch is finally being unwound?
The Internet computer price tension between horizons: daily strength meets hourly hesitation
The daily chart shows $ICP in a textbook bullish structure above all three EMAs with a climbing RSI, while the hourly MACD histogram has turned negative and kept widening to the downside, revealing short-term momentum fading inside a larger uptrend. On the daily chart, the structure is about as clean as it gets: price sits above the EMA20 ($3.156), EMA50 ($2.8548) and EMA200 ($2.6192), and the EMA order itself is textbook bullish — fast average above the medium one, medium above the long one. The daily RSI climbed from 66.7 to 66.8 to 72.9 across the last three completed sessions, and the daily MACD histogram widened over the same stretch (0.0159 → 0.0123 → 0.0221), both pointing to accelerating buying pressure into the $3.59 close.
The hourly chart tells a different short-term story. Price is below the hourly EMA20 ($3.4797) but still holding above the hourly EMA50 ($3.4289) and EMA200 ($3.3167). The hourly EMA order remains bullish, but the hourly MACD histogram has turned negative and kept widening on the downside across the last three closes (-0.0092 → -0.0127 → -0.0137), a clear sign that short-term momentum is fading even while the bigger structure holds together. The 15-minute picture is more balanced than outright bearish: RSI at 42.35 has been essentially flat (43.3 → 42.3 → 42.3) and the MACD histogram has edged back into slightly positive territory, rising from 0.000616 to 0.00128 to 0.00178. That is a small, low-conviction move, more consistent with consolidation than with a fresh breakdown.
The disagreement is real: the daily chart still flashes an overbought, trending market, while the hourly chart shows fading momentum right as price tests the pivot, and the 15-minute chart simply goes sideways while it waits for one of the two to win out.
EMA structure, Bollinger bands and ATR show where the squeeze is tightening
$ICP sits in the upper half of the daily Bollinger band with daily ATR near $0.236, while the 15-minute band has compressed to a tight range around $3.47, signaling a breakout is approaching. Daily volatility, measured by the 14-period ATR, sits at roughly $0.236 — a meaningful chunk of the current $3.452 price, which means single-session swings of that size should not be read as confirmation of a trend shift on their own. The daily Bollinger setup (mid $3.1116, upper $3.6277, lower $2.5955) still has price trading in the upper half of the band, closer to the upper line than the mid, which fits with a market that ran hot before this latest pullback.
On the hourly timeframe, the Bollinger mid at $3.5001 now sits above the live price, and the band’s lower edge at $3.374 is the next real cushion if the pullback extends. Hourly ATR of about $0.053 is far more muted than the daily figure, typical of a market taking a breather rather than reversing hard. The 15-minute EMAs are not aligned: price sits below both the EMA20 ($3.4755) and EMA50 ($3.4885) but above the EMA200 ($3.4266), so the market calls this structure mixed rather than trending in either direction. The tight 15-minute Bollinger band (mid $3.471, upper $3.5077, lower $3.4343) with an ATR of just $0.0201 confirms how compressed the short-term range has become.
RSI and MACD readings across timeframes disagree on direction
The daily RSI at 72.85 is overbought and was still rising into the last close, but the hourly RSI sits at a neutral 50.31 and the hourly MACD histogram has been losing ground across its last three readings. The daily RSI is the standout reading here — it is not just elevated, it has been climbing steadily through its last three completed readings, which tells you buyers were firmly in control into the last daily close. The hourly RSI at 50.31 is about as neutral as it gets, and its last three closed readings (52.7, 48.4, 50.3) move without a clear direction, fitting an hourly chart that is rangebound rather than trending. The 15-minute RSI at 42.35 is edging toward the lower half of its range but is nowhere close to an oversold extreme, and its recent readings have been flat rather than falling.
MACD adds another layer. The daily histogram is positive at 0.0221 and has been widening over its last three closes, arguing that daily momentum was still building into the most recent session even as spot price has since dipped under the pivot. The hourly histogram, by contrast, is negative at -0.0137 and has been fading across its last three readings, underlining that short-term momentum has rolled over. The 15-minute histogram is positive but tiny, at 0.00178, and rising off an almost flat base; it signals stabilization at this stage rather than a fresh push higher.
Key levels and the bull/bear scenarios for $ICP
A daily close back above the daily pivot at $3.479 would open the path toward $3.6277 and then the daily R1 at $3.72, while an hourly close below $3.44 would expose the hourly Bollinger lower band at $3.374. On the daily chart, the nearest resistance above is the daily pivot at $3.479, followed by the daily Bollinger upper band at $3.6277 — which coincides with the hourly Bollinger upper band at the same value — and then the daily R1 at $3.72. Below current price, the daily S1 at $3.349 is the first real cushion, with the daily EMA20 at $3.156 and the daily Bollinger mid at $3.1116 further down, and the daily EMA50 ($2.8548) and EMA200 ($2.6192) well below that as deeper structural supports.
On the hourly chart, the immediate resistance stack is the hourly pivot at $3.461, the hourly EMA20 at $3.4797 — itself the same value as the daily pivot — and the hourly R1 at $3.489, while the hourly S1 at $3.44 and the hourly EMA50 at $3.4289 sit just underneath the current price as the nearest floors.
The bullish case needs a daily close back above the daily pivot at $3.479 to be taken seriously; that would open the door toward the shared resistance at $3.6277 and ultimately the daily R1 at $3.72. That case gets invalidated if $ICP instead prints a daily close below the daily S1 at $3.349, which would undercut the near-term support cluster despite the EMA order still reading bullish.
The bearish case builds if $ICP posts an hourly close below the hourly S1 at $3.44, which would expose the hourly EMA50 at $3.4289 and then the hourly Bollinger lower band at $3.374 as the next stops lower. That pressure eases if price instead closes an hourly candle back above the hourly pivot at $3.461, which would point back toward the shared daily-pivot/hourly-EMA20 level at $3.479. The most likely false signal here is a shallow bounce off the hourly S1 that gets read as a reversal while the hourly MACD histogram is still negative and widening — that kind of bounce tends to fade rather than confirm, especially with daily ATR near $0.236 making single-session moves of this size fairly routine rather than decisive.
Market backdrop: Greed reading sits against a falling total market cap
The Fear & Greed Index reads 73 (Greed) even as total crypto market capitalization fell 3.13% to $2.91 trillion over 24 hours, a divergence that can produce choppy single-asset price action. The Fear & Greed Index from Alternative.me reads 73, classified as “Greed”, even as the total crypto market capitalization tracked by CoinGecko sits at $2.91 trillion, down 3.13% over the past 24 hours. Bitcoin dominance, per CoinGecko, is at 59.19%. That gap between a still-greedy sentiment gauge and a broader market that lost ground over the last day is worth keeping in mind: it suggests risk appetite has not fully caught up with the pressure showing up in aggregate market cap, which can make single-asset setups like this one more prone to whipsaws until the two line up.
FAQ
Where is $ICP trading right now?
$ICP is trading at $3.452 on Binance, below the daily pivot at $3.479, after closing the last completed daily candle at $3.59.
Is $ICP overbought?
The daily RSI is at 72.85, an overbought reading, and it rose over the last three completed daily sessions (66.7, 66.8, 72.9). The hourly RSI (50.31) and 15-minute RSI (42.35) are both in neutral territory, not overbought or oversold.
What would confirm a bullish continuation for $ICP?
A daily close back above the daily pivot at $3.479 would open the path toward the shared resistance at $3.6277 (daily Bollinger upper / hourly Bollinger upper) and then the daily R1 at $3.72.
What would confirm a bearish move for $ICP?
An hourly close below the hourly S1 at $3.44 would expose the hourly EMA50 at $3.4289 and the hourly Bollinger lower band at $3.374 as the next levels lower.
Disclaimer: This article is for informational purposes only and does not constitute financial advice, an investment recommendation, or a solicitation to buy or sell any financial instrument or cryptocurrency. The analysis provided is not indicative of future results. Investing in crypto assets and financial markets carries a high risk of capital loss. Always do your own research (DYOR) and consult a qualified financial advisor before making any decision.
Article produced with the assistance of artificial intelligence and reviewed by the editorial team.

 en.cryptonomist.ch