$NEAR Intents’ $3.8M exploit gets fully recovered as DEX volumes swing wildly
$NEAR Intents recovered the full $3.8 million stolen in its October 1 exploit within 48 hours, while on-chain DEX activity across the $NEAR blockchain tells a contradictory story with some venues surging and others cooling sharply. The exploit forced $NEAR Intents to pause cross-chain services on October 1, as reported by Coindesk. The project then identified the attacker and issued a 48-hour ultimatum on October 2, per Cointelegraph, and by October 3 the entire stolen amount had been recovered, according to Cointelegraph. Decrypt framed the episode with the question of whether it amounted to a bullish hack — a headline framing worth noting, though it remains a question rather than a settled read on price impact.
On-chain activity around $NEAR tells a genuinely mixed story. DefiLlama data puts DEX trading volume on the $NEAR blockchain as a whole at roughly $134.1 million over the past 24 hours. $NEAR Intents’ own volume jumped 82.1% in a day but is still down 30.2% over the past week. Rhea Dex rose 48.0% in 24 hours yet is down 62.7% over seven days and 53.4% over thirty. THORSwap, by contrast, is up sharply across every window — 330.6% in a day, 310.2% over a week, and 1,047.8% over a month. These are chain-wide volumes, not $NEAR-specific trading fees, and the divergence between venues means no single clean narrative of surging DEX activity exists right now.
Zooming out, CoinGecko puts total crypto market capitalization at roughly $2.91 trillion, down 3.11% over the past 24 hours, with Bitcoin dominance at 59.2%. Sentiment, however, does not match that pullback: the Fear & Greed Index from Alternative.me reads 73, squarely in Greed territory. That gap — a red day for the aggregate market against a greedy sentiment reading — is itself a small signal of conflicting forces at the macro level, separate from $NEAR’s own chart.
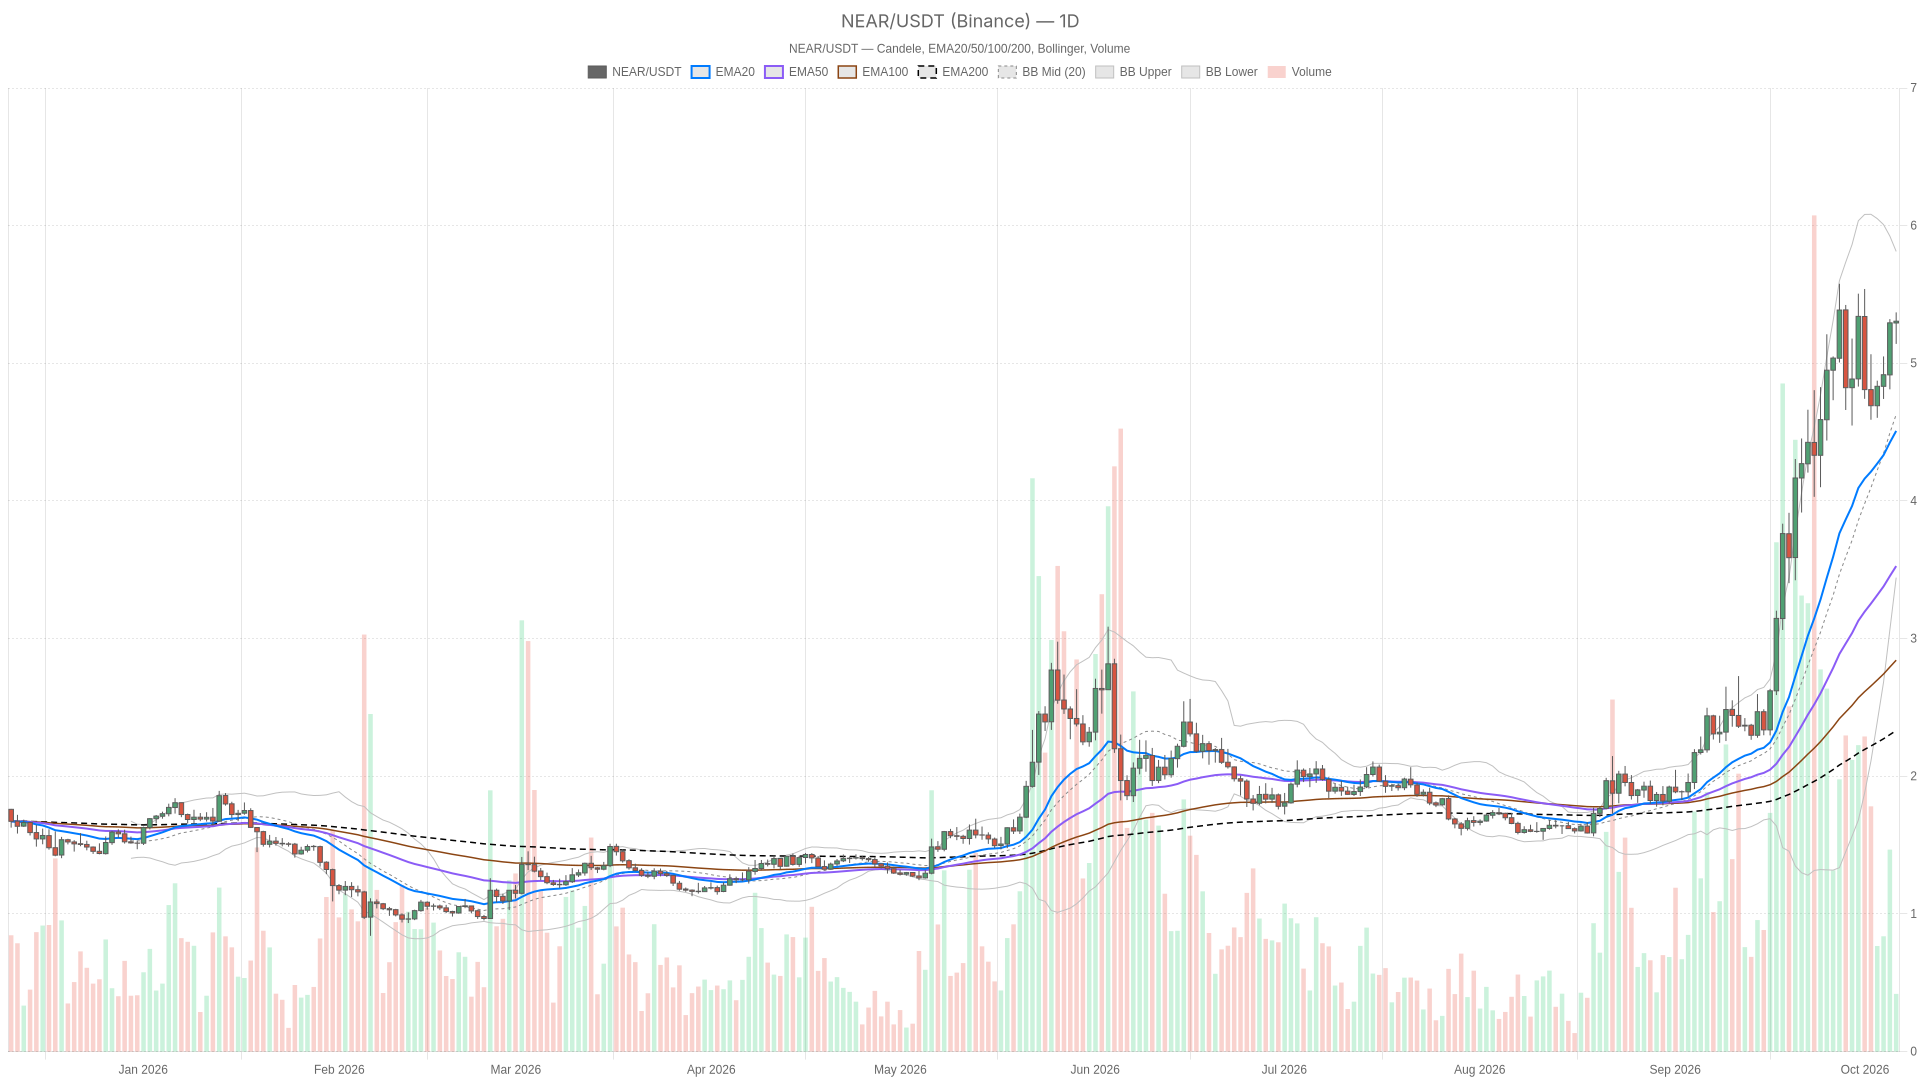
The Near price holds above every EMA across D1, H1 and M15
$NEAR sits above its EMA20, EMA50 and EMA200 on the daily, hourly and 15-minute charts, with a bullish EMA stack confirming trend alignment across all three timeframes. On the daily chart, price is above the EMA20 at $4.4249, EMA50 at $3.4544 and EMA200 at $2.3026, with shorter averages stacked above longer ones — a textbook bullish structure. The daily regime classification itself reads bullish. RSI has risen across the last three completed daily candles, from 64 to 65 to 68.9, now sitting just under the overbought threshold near 69.
The hourly picture backs this up structurally: price is above its EMA20 at $5.1881, EMA50 at $5.0667 and EMA200 at $4.9353, again a bullish EMA order. Hourly RSI has also climbed over its last three closes — 57.3, then 52.7, then 62.7 — landing at 62.7 now, a healthy intraday push without being stretched. The 15-minute chart shows the same alignment: price above its EMA20 at $5.2433, EMA50 at $5.2206 and EMA200 at $5.0568, bullish order once more. None of the three timeframes disagree on direction here, keeping the broader trend case simple even as momentum indicators complicate it.
Daily RSI near 69 clashes with a MACD histogram still printing red
The daily RSI has climbed to 69.0 after three consecutive higher closes, reflecting genuine building upside pressure rather than a one-off spike. The daily MACD line at 0.621 sits below its signal line at 0.657, leaving the histogram negative. The last three closed readings were mixed rather than trending in one direction, meaning the momentum indicator is not yet confirming the price strength — it is lagging behind it. Daily Bollinger Bands show price trading above the $4.4938 mid band with the upper band well above at $5.924, meaning there is real room before any mean-reversion pressure from the bands kicks in. Daily ATR sits near $0.48, underlining that moves of several percentage points in a session would not be unusual given recent range.
On the hourly chart, RSI at 62.7 has risen from 57.3 and 52.7 across the last three closes, consistent with the daily picture. The hourly MACD histogram, at roughly -0.008, is close to flat and its recent direction has been mixed — essentially straddling the zero line rather than confirming either a bullish or bearish push. Hourly Bollinger Bands put the mid band at $5.1828 and the upper band at $5.4109, with price already closer to the top of that range than the daily chart suggests. Hourly ATR sits around $0.10.
The 15-minute chart is where momentum actually looks the strongest. RSI at 59.4 has been mixed over the last three readings. However, the MACD histogram has been rising and widening — from 0.00726 to 0.0119 to 0.0133 — and is already positive. That is the clearest bullish momentum signal on any timeframe right now, but it is happening on the shortest chart, which carries the least weight for anything beyond intraday execution. The 15-minute Bollinger upper band sits at $5.3328 against a mid band of $5.231, meaning price is trading close to the top of its short-term range with limited room before hitting that ceiling.
Daily R1 at $5.473 is the level that decides what comes next
A daily close above daily R1 at $5.473 would confirm bullish continuation toward $5.924, while a daily close below S1 at $4.963 would open the path toward the daily EMA20 near $4.42. With price near $5.31, it is trading above the daily pivot at $5.142 and above daily S1 at $4.963, but still below daily R1 at $5.473 and well below the daily Bollinger upper band at $5.924. On the hourly chart, price is pressing just under hourly R1 at $5.3557, with the hourly Bollinger upper band at $5.4109 above that.
The bullish case needs a daily close above daily R1 at $5.473 to confirm continuation; that would open the path toward the daily Bollinger upper band near $5.924. Given where the hourly chart sits, such a move would likely coincide with an hourly close above hourly R1 at $5.3557, aligning short-term momentum with the daily trend. This scenario would be invalidated by a daily close back below the daily pivot at $5.142, which would suggest the breakout attempt lost steam before it even confirmed.
The bearish case centers on a daily close below daily S1 at $4.963, which would expose the daily Bollinger mid band near $4.49 and the daily EMA20 near $4.42 as the next areas of interest. That case would be invalidated by a daily close back above the daily pivot at $5.142, or more decisively by a reclaim of daily R1. There is a shorter-term wrinkle worth flagging: an hourly close below hourly S1 at $5.1907 would signal stalling intraday momentum even while the daily EMA structure remains bullish. This is a reminder that the higher timeframe trend and the next few hours of price action do not have to move in lockstep. Treating a single hourly rejection as a trend change would likely be the most common false signal here.
FAQ
What is $NEAR doing right now?
$NEAR is trading near $5.31 on Binance, above its daily, hourly and 15-minute EMAs, with the daily regime reading bullish.
Is $NEAR’s RSI overbought?
Not yet. The daily RSI sits near 69, approaching but not past the overbought threshold of 70; the hourly RSI reads 62.7 and the 15-minute RSI is near 59.4.
What would confirm a bullish continuation for $NEAR?
A daily close above the daily R1 at $5.473 would support a move toward the daily Bollinger upper band near $5.924; a daily close back below the daily pivot at $5.142 would invalidate that case.
What happened with the $NEAR Intents hack?
$NEAR Intents was hit by a $3.8 million exploit on October 1 and paused cross-chain services, as reported by Coindesk. It identified the attacker and issued a 48-hour ultimatum on October 2, per Cointelegraph, and the full stolen amount was recovered, as reported by Cointelegraph on October 3.
Disclaimer: This article is for informational purposes only and does not constitute financial advice, an investment recommendation, or a solicitation to buy or sell any financial instrument or cryptocurrency. The analysis provided is not indicative of future results. Investing in crypto assets and financial markets carries a high risk of capital loss. Always do your own research (DYOR) and consult a qualified financial advisor before making any decision.
Article produced with the assistance of artificial intelligence and reviewed by the editorial team.

 en.cryptonomist.ch