XRP Inverse Head and Shoulders Pattern Eyes Breakout Above $2
thecryptobasic.com
1 h
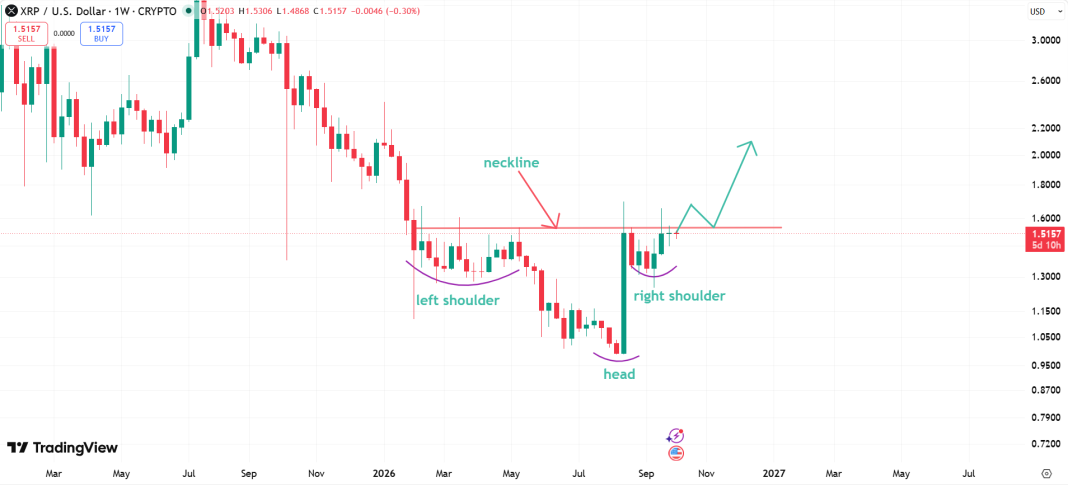
$XRP is now looking to break above the neckline of an inverse head and shoulders pattern, with prices targeting a run above $2.
$XRP’s price action has been rather favorable to bulls over the past few weeks. After suffering consistent declines from July 2025 to June 2026, $XRPembarked on a recovery campaign in July 2026and has now recorded three consecutive monthly green candles for the first time in a year.
$XRP Forms Inverse H&S Pattern
Interestingly, the recent performance has brought $XRP close to completing a bullish inverse head and shoulders pattern that started forming early this year and has held over the past months.
Know when your coins move
Alerts, real-time prices, and market news — all in one app
4.8 based on 40K reviews in the App Store and Google Play
For context, an inverse head and shoulders is a bullish technical pattern that often appears near the end of a downtrend. It features three troughs, with the middle one (the head) forming the lowest point and the other two (left and right shoulders) forming shallower lows.
This structure began for $XRP after the asset collapsed from the $2.41 peak in early January 2026. From there, $XRP dropped to around $1.55, held this area, and then gradually dropped lower to $1.27 by April 2026 before recovering to $1.54 in May. This formed the left shoulder.
$XRP Inverse Head and Shoulders Pattern
Meanwhile, the head formed when$XRPdropped again to hit a lower low of $0.98 in August 2026 before rebounding and launching the latest recovery campaign. This head showed that bears mounted greater selling pressure, but the market eventually rebounded from the downturn.
$XRP’s recovery pushed it back above $1.5, but the asset continued to face intermittent declines, dropping to $1.25 in mid-September before recovering to $1.51 again. This price action helped form the right shoulder.
What Confirms a Breakout
Notably, the inverse H&S structure often becomes more important when the asset’s price moves above the neckline, the resistance level connecting the recovery highs. A confirmed breakout could suggest that buyers are gaining control and that the price may move higher.
In $XRP’s case, the neckline sits at around $1.54-$1.55, just slightly above the current price of $1.51. $XRP must sustain its current recovery campaign and push above the $1.54 area to confirm a breakout above the neckline, which would complete the pattern formation.
A break above this neckline may lead to a pullback to retest the breakout. If $XRP holds above the $1.5 area when such a pullback plays out, the breakout strength would be confirmed, possibly pushing prices to greater heights. The measured move points to the $2 area as the possible target.

 thecryptobasic.com