Broader market cap near $2.91 trillion as BTC dominance sits at 59.2%
Total crypto market capitalization sits near $2.91 trillion with Bitcoin dominance at 59.23%, providing important context for $VIRTUAL’s relative strength as the broader market pulls back. Per CoinGecko, the market cap is down 2.74% over the past 24 hours, while Bitcoin dominance holds at 59.23%. The Fear & Greed Index sits at 70 (Alternative.me), in Greed territory, reinforcing that sentiment remains elevated.
That backdrop is worth flagging because the $VIRTUAL price is holding its ground — and even extending gains versus its last completed daily close — at a moment when the wider market is pulling back. The divergence points to asset-specific demand rather than a broad risk-on tide, a dynamic worth watching if the overall market mood sours further.
Daily EMA stack stays textbook bullish, but hourly and 15-minute price action diverge
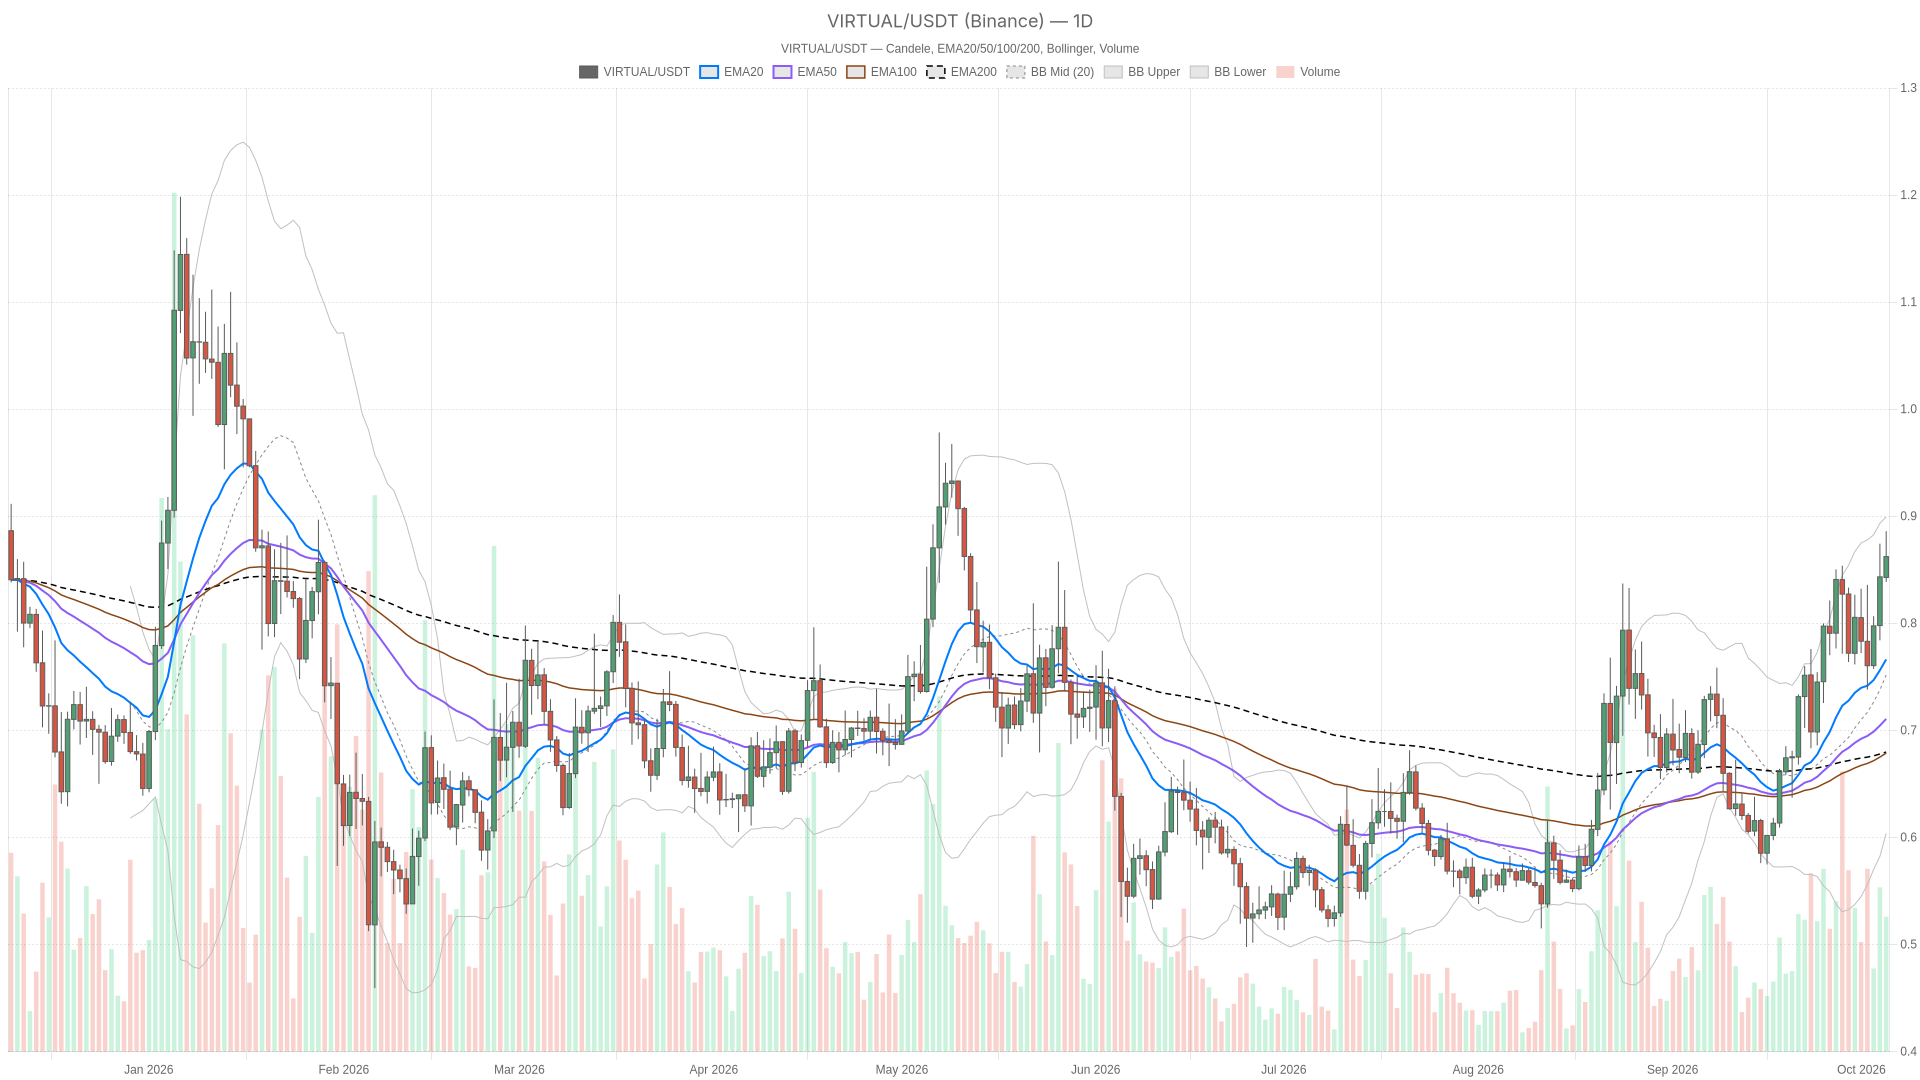
$VIRTUAL’s daily EMA structure leaves little room for doubt: price sits above the EMA20 ($0.75622), EMA50 ($0.70452) and EMA200 ($0.67793), with all three averages stacked in textbook bullish order. The hourly chart tells a similar structural story — price remains above its EMA20 ($0.85478), EMA50 ($0.82956) and EMA200 ($0.8005), with the averages again aligned bullishly.
However, structure and momentum are not always in agreement. On the 15-minute chart, price has slipped below both the EMA20 ($0.86936) and EMA50 ($0.86382), even though it remains above the EMA200 ($0.83086) and the short-term EMA order itself is still stacked bullish. In practice, that is a short-term pullback inside a bigger uptrend — the kind of setup where the daily trend is intact but the most recent candles are chopping sideways to lower just beneath it.
Daily RSI rising toward 63 as hourly momentum fades from a higher reading
The daily RSI has climbed over its last three closed readings to 62.9, confirming that momentum on the higher timeframe is building rather than merely coasting, while the hourly RSI tells a different story of fading thrust. The sequence — 54.4, then 58.5, then 62.9 — lines up with the bullish EMA stack. It is approaching overbought territory but has not crossed the 70 threshold, so there is still room before the daily chart would flag itself as stretched.
The hourly RSI, by contrast, has been falling — from 69.4 to 63.1 over its last three closed candles — even though the absolute level is still firmly on the bullish side of neutral. That is the cooling-momentum signal worth paying attention to: price is holding up, but the pace of the advance on the hourly timeframe is losing steam.
Meanwhile, the 15-minute RSI sits around 45.2 and is essentially flat across its last three readings, simply confirming that the shortest timeframe is in a holding pattern rather than trending either way.
MACD tells a matching story. On the daily chart the histogram is positive and widening, which fits with a trend that is still gaining conviction. On the hourly chart, however, the histogram has flipped from positive to negative over its last three readings and has crossed below the zero line — a clear sign that near-term momentum has turned down even while the broader hourly structure stays bullish. Similarly, the 15-minute histogram is negative but flat, offering no fresh directional signal, just confirmation that the shortest-term tape is in limbo.
Volatility context adds more color. The daily Bollinger Bands have $VIRTUAL riding close to the upper band at $0.89336, with the mid-band at $0.73786 and the lower band down at $0.58236 — a wide range that reflects how far the daily trend has already stretched. The daily ATR of roughly $0.062 underlines that moves of several cents in either direction are well within normal daily behavior for this asset.
On the hourly chart, meanwhile, price sits between the Bollinger mid ($0.85775) and upper band ($0.88583), with an ATR near $0.0135, while the 15-minute bands have price below the midline ($0.87243) with a much tighter ATR near $0.0068 — consistent with the short-term consolidation already flagged in the RSI and MACD readings.
Key levels: daily R1 at $0.88383 versus hourly support at $0.86023
With $VIRTUAL at $0.8623, the nearest overhead resistance on the daily chart sits at the daily R1 ($0.88383) and the daily Bollinger upper band ($0.89336). On the hourly timeframe, resistance builds just above current price at the hourly pivot ($0.86587), the hourly R1 ($0.87083) and the hourly Bollinger upper band ($0.88583).
Below current price, the hourly S1 at $0.86023, the hourly Bollinger mid at $0.85775 and the hourly EMA20 at $0.85478 form the first layer of support, with the hourly EMA50 ($0.82956) and hourly Bollinger lower band ($0.82968) sitting further down. On the daily chart, the daily pivot at $0.83397 is the first real support, followed by the daily S1 at $0.79353 and the daily EMA20 at $0.75622.
The bullish scenario hinges on a daily close above the daily R1 at $0.88383, which would open the path toward the daily Bollinger upper band at $0.89336 and suggest the daily uptrend is absorbing the recent hourly momentum loss without much damage. That case would be invalidated by a daily close back below the daily pivot at $0.83397, which would signal the pullback has gone deeper than a routine hourly cooldown.
Conversely, the bearish scenario centers on an hourly close below the hourly S1 at $0.86023, which would confirm the hourly momentum fade is translating into actual price weakness and could pull $VIRTUAL toward the hourly EMA50 at $0.82956. That setup would be invalidated by an hourly close back above the hourly pivot at $0.86587, which would put buyers back in control of the near-term tape and ease the divergence between the daily and hourly readings.
The real risk here is treating the hourly MACD’s move below zero as a trend reversal when the daily chart — and the overall EMA structure across every timeframe — still points bullish. A shallow, short-lived dip that holds above the hourly S1 and the daily pivot would be consistent with normal consolidation inside an intact uptrend, not a change in the broader bias.
FAQ
What is $VIRTUAL doing right now?
As of October 5, 2026, $VIRTUAL is trading at $0.8623 on Binance, above its last completed daily close of $0.8434 and above every major daily moving average.
Is the daily trend for $VIRTUAL bullish or bearish?
The daily regime is bullish, with price above the EMA20, EMA50 and EMA200, a textbook bullish EMA order, a rising RSI near 63, and a MACD histogram that is positive and widening.
Why is the hourly chart showing weaker momentum?
The hourly RSI has fallen from 69.4 to 63.1 over its last three closed readings, and the hourly MACD histogram has turned negative after crossing below zero, even though price remains above all three hourly EMAs.
What are the key levels to watch for $VIRTUAL’s next move?
A daily close above the daily R1 at $0.88383 would support a bullish breakout toward $0.89336, while an hourly close below the hourly S1 at $0.86023 would signal further downside toward $0.82956. A daily close below $0.83397 invalidates the bullish case, and an hourly close above $0.86587 invalidates the bearish one.
Disclaimer: This article is for informational purposes only and does not constitute financial advice, an investment recommendation, or a solicitation to buy or sell any financial instrument or cryptocurrency. The analysis provided is not indicative of future results. Investing in crypto assets and financial markets carries a high risk of capital loss. Always do your own research (DYOR) and consult a qualified financial advisor before making any decision.
Article produced with the assistance of artificial intelligence and reviewed by the editorial team.

 en.cryptonomist.ch