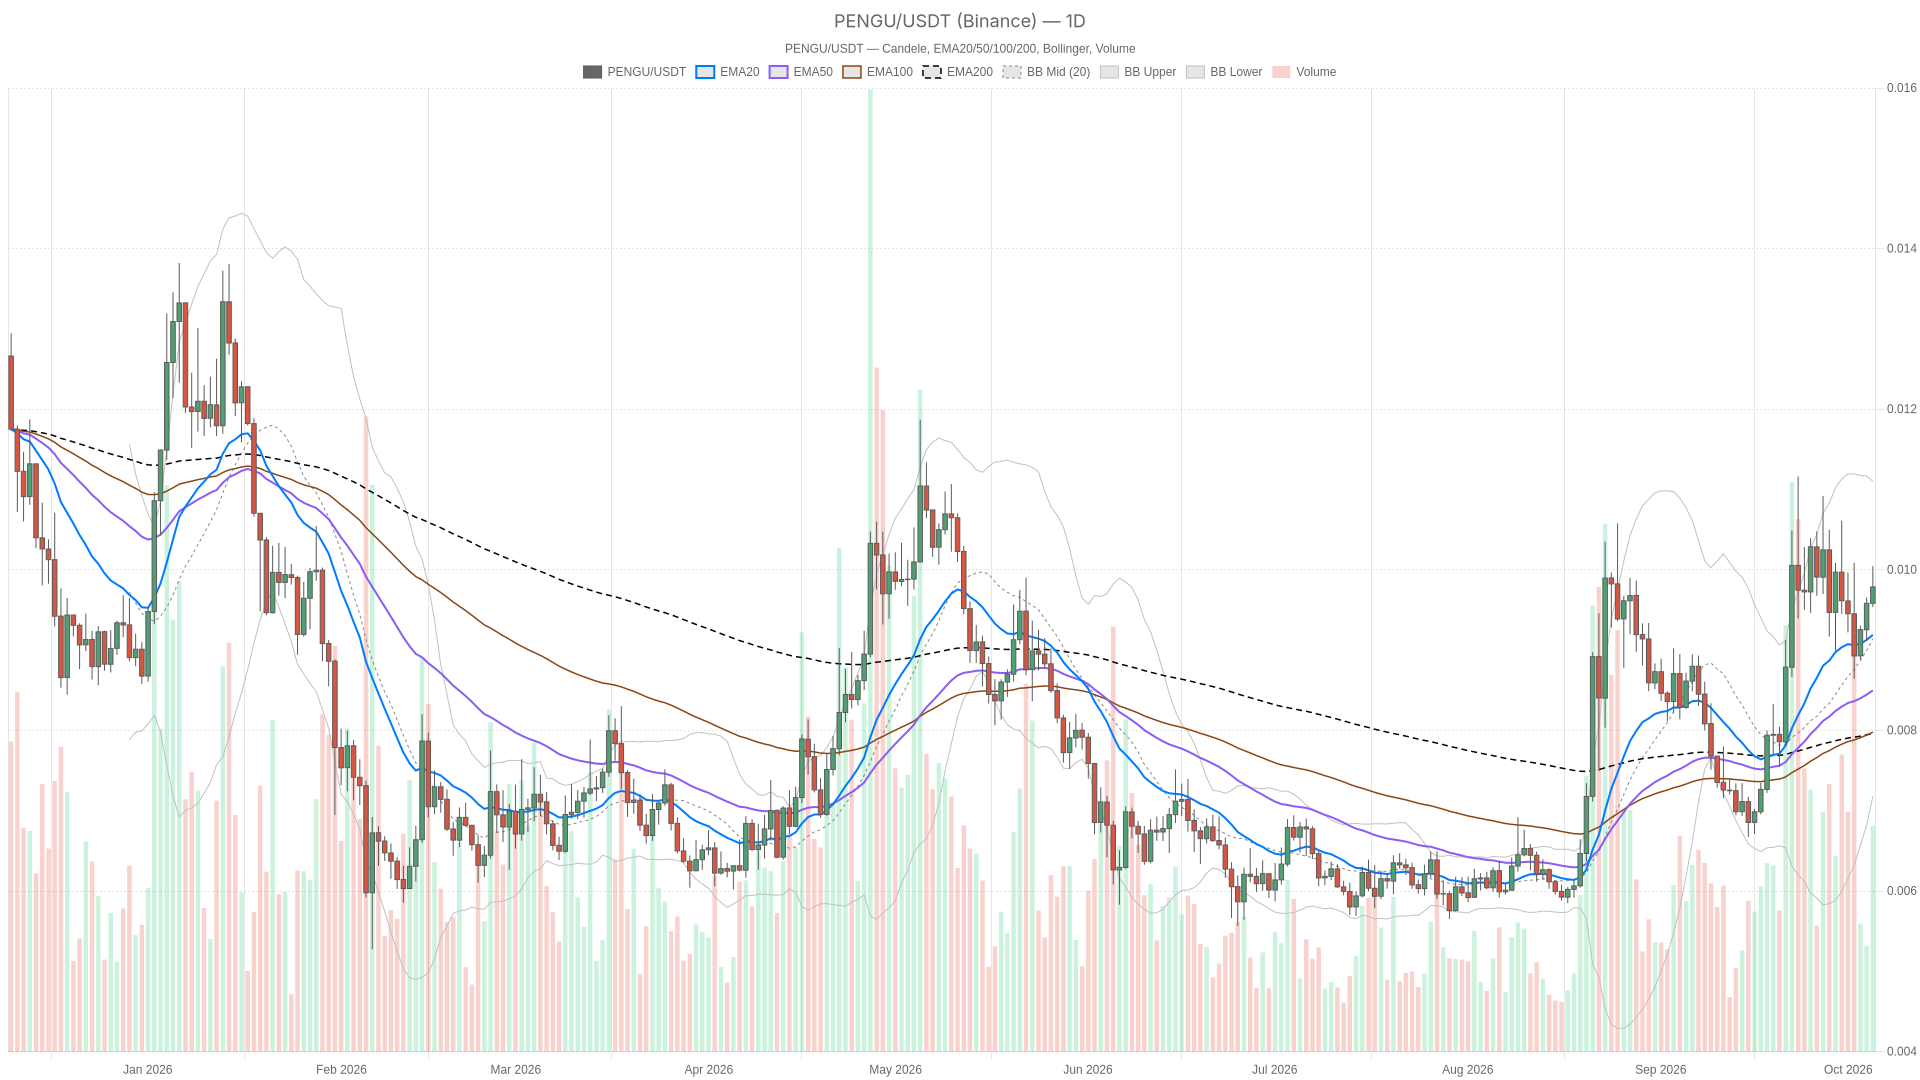
The tension in this setup is between a daily chart that still looks constructive and shorter-term momentum that’s starting to wobble. On the daily timeframe, price sits above the EMA20, EMA50 and EMA200, with the averages stacked in a textbook bullish order — that’s the dominant structural force right now.
The hourly and 15-minute pictures, however, are messier, with momentum indicators losing conviction even as price grinds sideways to slightly higher. When the bigger trend is intact but the smaller timeframes start dragging their feet, it usually means the market is deciding whether to consolidate before the next leg or quietly roll over.
Pengu price action tests daily R1 as broader market cap dips 0.84%
There’s no $PENGU-specific news or DEX flow in the data to point to, so the backdrop here is purely macro. CoinGecko’s figures put total crypto market capitalization at roughly $2.94 trillion, down 0.84% over the past 24 hours, with Bitcoin dominance at 58.79%. That’s a mildly risk-off tone at the index level, even if it’s not dramatic. Meanwhile, the Fear & Greed Index from Alternative.me reads 70, which lands in “Greed” territory — sentiment is leaning optimistic even as the aggregate market cap ticks lower, a contradiction worth keeping in mind when sizing up conviction behind the current $PENGU move.
EMA structure stays bullish on daily but the hourly averages aren’t aligned
On the daily chart, price trades above all three EMAs — the 20 at $0.0091273, the 50 at $0.0084456 and the 200 at $0.0079447 — and the order is bullish, meaning the 20 sits above the 50 which sits above the 200. That’s the cleanest bullish structure on the board and the main reason the broader bias still leans constructive.
The hourly tells a slightly different story. Price is also above its EMA20 ($0.0097135), EMA50 ($0.0095327) and EMA200 ($0.0096059), but the EMA order itself is mixed rather than aligned. The averages aren’t stacked the way they are on daily, which points to recent chop rather than a clean trend on that timeframe.
On the 15-minute chart, price is below the EMA20 ($0.0098392) and EMA50 ($0.0097939) but still above the EMA200 ($0.0095451), even though the EMA order there is bullish. In other words, the short-term averages are stacked correctly in theory, but price has slipped beneath the two faster ones — a sign of short-term fatigue inside a still-intact bigger structure.
Daily RSI keeps climbing while the MACD histogram tells a more cautious story
Daily RSI has climbed from 50.7 to 53.7 to 56.5 across the last three completed candles — nowhere near overbought, but clearly gaining ground and consistent with the bullish EMA backdrop. The hourly RSI, at 58.99, has been choppier: 64.8, then 56.5, then 59.0, a mixed sequence that doesn’t give a clean read either way. The 15-minute RSI has been climbing too, from 45.3 to 49.4 to 54.3, suggesting the micro-trend is trying to turn up again after cooling off.
MACD is where the daily picture gets more interesting. The daily histogram is negative and widening — it’s gone from -0.0000115 to -0.0000409 to -0.0000403 over the last three closed candles — which signals that upside momentum has been fading even while price itself keeps grinding higher. That’s a classic case of price and momentum disagreeing, and it’s worth taking seriously rather than dismissing.
On the hourly, the histogram has just crossed into negative territory, flipping from a positive 0.0000064 to -0.00000518 and then -0.00000971, which lines up with the mixed hourly RSI and the non-aligned EMA order. Momentum on that timeframe has genuinely turned down, at least for now. The 15-minute histogram is also negative but narrowing, moving from -0.000012 to -0.00000967 to -0.00000436, pointing to downside pressure fading at the micro level even if it hasn’t flipped positive yet.
Bollinger Bands add context on how stretched price is. On daily, $PENGU trades above the band’s mid-point at $0.0089942 but still well below the upper band at $0.011169, so there’s room before any overextension signal kicks in. On the hourly, price sits just above the mid-band at $0.0097259 and below the upper band at $0.010048.
On the 15-minute chart, price has drifted below its mid-band of $0.0098379 and is sitting closer to the lower band at $0.009736, reinforcing the sense of short-term consolidation rather than a clean breakout structure. Daily ATR stands at roughly $0.00086, which relative to the current price represents a sizable potential daily range — a reminder that moves in either direction could be sharp even while the bigger trend holds.
Key levels and how the bull and bear cases split from here
The pivot structure is the clearest way to frame what happens next for $PENGU. On daily, R1 sits at $0.009785 — a level price is currently trading just above intraday, even though the prior daily close of $0.009583 was still beneath it. The daily pivot sits lower at $0.009453, daily S1 at $0.009251, and the daily Bollinger upper band caps the chart at $0.011169.
On the hourly, the pivot is at $0.0098157 with R1 at $0.0098753 above it, while hourly S1 sits at $0.0097663 below. Notably, the current hourly price of $0.009781 is trading just under its own pivot, which is the clearest sign of the tension between the still-bullish daily frame and a hesitant hourly one.
Bullish scenario: a daily close above the daily R1 at $0.009785 would confirm the reclaim that’s currently only showing up intraday, and would open the path toward the daily Bollinger upper band at $0.011169. This case is invalidated if the daily candle closes back below the daily pivot at $0.009453, which would expose daily S1 at $0.009251 and undercut the bullish EMA structure that’s currently supporting the broader bias.
Bearish scenario: a daily close back below the daily R1 at $0.009785 would suggest the intraday push above it was a false start, pulling price toward the daily pivot at $0.009453 and potentially daily S1 at $0.009251. That bearish read gets undercut if the hourly candle closes back above the hourly R1 at $0.0098753 — a move that would hint that buyers are absorbing the dip before the daily candle even confirms a breakdown.
Given that daily momentum is already diverging from price even in the bullish scenario, and that the Fear & Greed reading of 70 shows sentiment running hotter than the mixed hourly and 15-minute signals really justify, the most likely false signal here is a quick push through daily R1 that fails to hold by the close. That’s exactly the kind of move that would trap late bulls if the hourly weakness bleeds back into the daily chart.
FAQ
Where does $PENGU trade right now?
$PENGU trades at $0.009787 on Binance, just above the daily R1 pivot at $0.009785, after the last completed daily candle closed at $0.009583.
Is $PENGU overbought or oversold?
No. The daily RSI reads 56.5, the hourly sits at 58.99, and the 15-minute is at 54.34 — none of these are in overbought or oversold territory based on the current readings.
What would confirm a bullish continuation for $PENGU?
A daily close above the daily R1 at $0.009785 would confirm the move, with the daily Bollinger upper band at $0.011169 as the next level in view. This is invalidated by a daily close below the daily pivot at $0.009453.
What would confirm a bearish move for $PENGU?
A daily close back below the daily R1 at $0.009785 would point toward the daily pivot at $0.009453 and daily S1 at $0.009251.
Disclaimer: This article is for informational purposes only and does not constitute financial advice, an investment recommendation, or a solicitation to buy or sell any financial instrument or cryptocurrency. The analysis provided is not indicative of future results. Investing in crypto assets and financial markets carries a high risk of capital loss. Always do your own research (DYOR) and consult a qualified financial advisor before making any decision.
Article produced with the assistance of artificial intelligence and reviewed by the editorial team.

 en.cryptonomist.ch