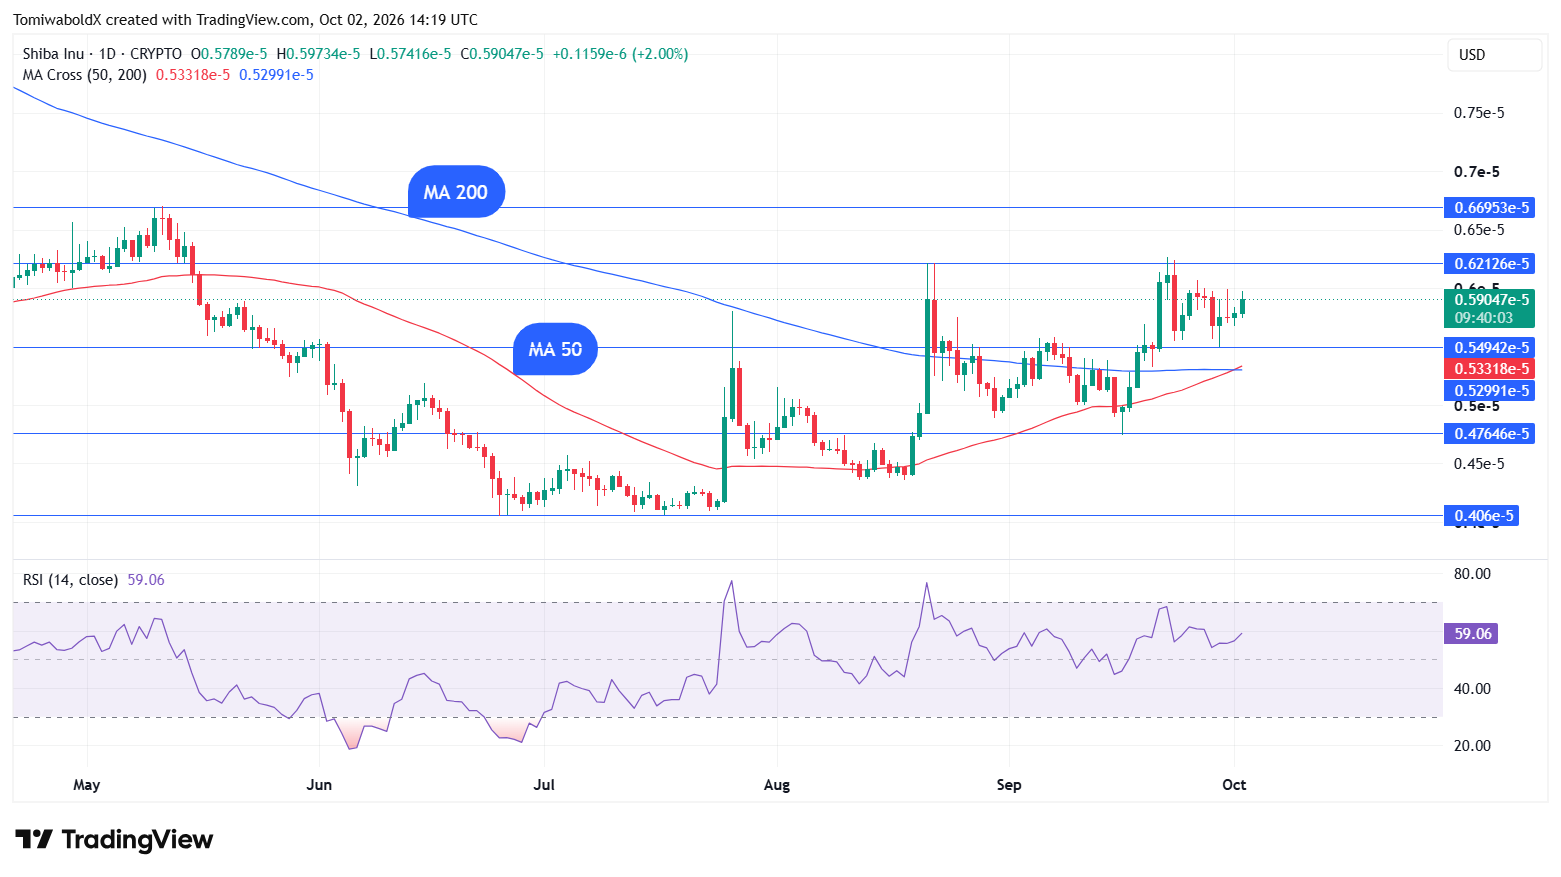
The months that followed saw more selling pressure, culminating in a death cross on Shiba Inu's daily chart in Feb. 2025.
Still, a golden cross signal on the daily timeframe was cut short in August 2025, before it could even form, only to be followed by a death cross in September 2025. Shiba Inu has generated two death cross signals in the last two years, with bears refusing to let bulls through until now.
What's next?
The golden cross formation coincided with a rebound from a low of $0.00000550 on September 29, with Shiba Inu entering its fourth day of gains. At the time of writing, $SHIB was up 3.24% in the last 24 hours to $0.000005936 and up 1.52% weekly.
Traders now watch for what comes next for Shiba Inu's price in the wake of the latest daily golden cross.
Most of the time, Shiba Inu's daily golden cross signal has coincided with a period of recovery following months of selling. This is evidenced by the fact that Shiba Inu completed a death cross in July 2024, months before the daily golden cross appeared in November 2024.
If this particular scenario plays out, Shiba Inu may extend its current recovery, targeting $0.00001. On the other hand, support is anticipated at the 50-day and 200-day moving averages around $0.00000533 in the event the price declines.

 u.today