Shiba Inu Price Prediction October 2026: Can SHIB Build on a 13.5% September?
coinedition.com
02 October 2026 18:27, UTC
Shiba Inu price prediction for October stays bullish above $0.00000565, the level $SHIB needs to hold to keep its recent rally on track toward $0.00000650.
Shiba Inu Price Analysis: Can $SHIB Reach $0.00000650 in October?
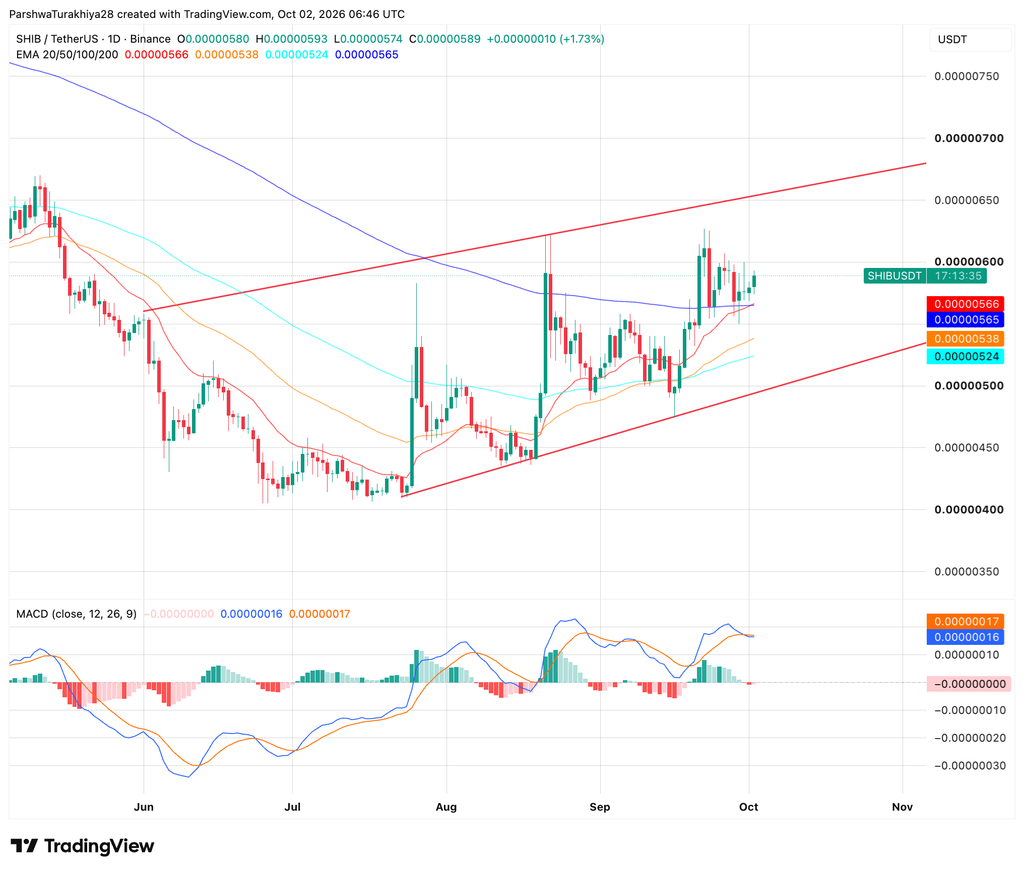
Shiba Inu Price Analysis (Source: TradingView)
$SHIB trades at $0.00000589, up 1.73% today, and the upper trendline near $0.00000650 is about 10% away, but price first has to clear $0.00000600 and the late-September high near $0.00000625. Two rising trendlines, one along the lows since late July and one along the August high, have contained price since then, with the lower line now near $0.00000495.
Know when your coins move
Alerts, real-time prices, and market news — all in one app
4.8 based on 40K reviews in the App Store and Google Play
Just under price, the 20-day EMA at $0.00000566 and the 200-day EMA at $0.00000565 sit almost on top of each other and form the first support zone, with the 50-day at $0.00000538 and the 100-day at $0.00000524 further down. MACD has slipped just under its signal line, 0.00000016 against 0.00000017, which suggests the momentum behind September’s push has flattened.
Related: Solana Price Prediction October 2026: SOL Eyes $135 as Fiserv’s Stablecoin Platform Goes Live on Solana
$SHIB Support and Resistance Levels, October 2026
Type
Price
Resistance
$0.00000600
Resistance
$0.00000625
Resistance
$0.00000650
Support
$0.00000565
Support
$0.00000538
Support
$0.00000524
Shiba Inu October Seasonality: Four Gains in Five Years
$SHIB has closed October higher in four of the five completed years since 2021, with a median gain of 6.04%. The 167.46% average comes almost entirely from the 833.6% surge in 2021, so the median is the better guide, and October 2025 was the only loss at 15.2%.
September’s 13.5% gain compares with a September median of 0.83% and extended a run of green months that began in July. Applied to $0.00000589, the median October return implies about $0.00000625, the same area as the late-September high, though with 2.59% already booked this month it likely overstates the upside. It is a historical reference rather than a target.
Year
October Return
2026 (month to date, excluded)
+2.59%
2025
-15.2%
2024
+2.46%
2023
+6.04%
2022
+10.4%
2021
+833.6%
Average (2021 to 2025)
+167.46%
Median (2021 to 2025)
+6.04%
$SHIB News: LuckSide Crypto Flags a Monthly Signal and a Bullish Altcoin MACD
LuckSide Crypto said $SHIB’s September gain of about 13.5% completed three straight green months, its first such run since late 2024, and that the monthly RSI is now sitting on its signal line in what he reads as the first bullish signal since November 2023.
He added that the altcoin total market cap’s monthly MACD has flipped bullish for the first time in 19 months, noting that alts rallied for months after the last two flips. He called the structure a bull pennant and said a break above its top would start the next move, while stressing that none of this is a guarantee.
$SHIB News: LuckSide Crypto Makes the Case for $SHIB Over Other Meme Coins
LuckSide, who says he has held $SHIB, argued that its fundamentals set it apart from other meme coins:
Exchange supply sits near 14% of circulating supply, which he said is less than half of what it was at the same point last cycle.
Holder counts keep setting records, a trait he compares with Bitcoin and Ethereum.
$SHIB’s supply can only fall through burns, while he said Dogecoin’s keeps growing.
These are his own figures and the video does not source them. He also said the SEC has classed $SHIB as a digital commodity, a claim the video does not source either.
$SHIB Burns: Burn Activity Is Concentrated in a Few Large Days
The 30-day burn chart shows most days well under 20 million, with five spikes above 40 million and the three largest at roughly 68 million to 73 million, the latest around September 29.
Related: Chainlink Price Prediction October 2026: Can LINK Hold Its August Breakout Through October?
Because burns permanently remove tokens from circulation, the supply story LuckSide describes depends on those occasional large days more than on a steady daily rate.
Shiba Inu Price Prediction for October 2026: Week-by-Week Outlook
Period
Expected Range
Key Levels
Oct 1 to 7
$0.00000565 to $0.00000610
The 20-day and 200-day EMAs near $0.00000565 need to hold, with $0.00000600 as the first hurdle.
Oct 8 to 14
$0.00000538 to $0.00000625
A close above $0.00000600 puts the September high in range, while losing $0.00000565 brings in the 50-day EMA at $0.00000538.
Oct 15 to 21
$0.00000538 to $0.00000650
A close above $0.00000625 opens the upper trendline near $0.00000650, with the 50-day EMA as the floor.
Oct 22 to 31
$0.00000520 to $0.00000670
The October 28 Fed decision sets the tone, with the upper trendline climbing toward $0.00000670 and the lower line near $0.00000520 as support.
Shiba Inu Price Prediction: Bullish and Bearish Scenarios for October
Bullish Case, Target: $0.00000650
$SHIB holds the 20-day and 200-day EMAs near $0.00000565, closes a day above $0.00000600, then clears the late-September high near $0.00000625. That opens the upper trendline near $0.00000650, which climbs toward $0.00000670 by late October, with the monthly signals LuckSide Crypto flags as added support.
$SHIB loses the EMA zone near $0.00000565 while MACD keeps slipping under its signal line, then closes below the 50-day EMA at $0.00000538. That would expose the 100-day EMA at $0.00000524 and the lower trendline near $0.00000495.
Related: Dogecoin Price Prediction: Can DOGE Clear $0.10 in October as ETF Inflows Return?
FAQs
What is the Shiba Inu price prediction for October 2026?
$SHIB could extend toward $0.00000600 and then $0.00000650 in October if it holds above $0.00000565. A daily close below the 50-day EMA at $0.00000538 would put the 100-day EMA at $0.00000524 in play.
Will Shiba Inu reach $0.00001 in October?
It is very unlikely. $0.00001 would need a gain of about 70% from $0.00000589, and only October 2021, at 833.6%, has delivered that in the five completed years. The upper trendline near $0.00000650 is the more realistic stretch at about 10%.
Could Shiba Inu fall below $0.00000500 in October?
Yes, if it loses the EMA zone near $0.00000565 and the 50-day EMA at $0.00000538. $0.00000500 is a drop of about 15%, which only October 2025, at 15.2%, matched in the five completed years, and the lower trendline sits just below at about $0.00000495.
How has Shiba Inu performed in October historically?
$SHIB closed October higher in four of five completed years from 2021 through 2025, with a median gain of 6.04%. The 833.6% surge in 2021 pushes the average to 167.46%, so the median is the better guide, and October 2025 fell 15.2%.

 coinedition.com