SOL Price LIVE: Tuesday Range Manipulation Could Drive a Move Toward $124.13
coinedition.com
29 September 2026 13:02, UTC
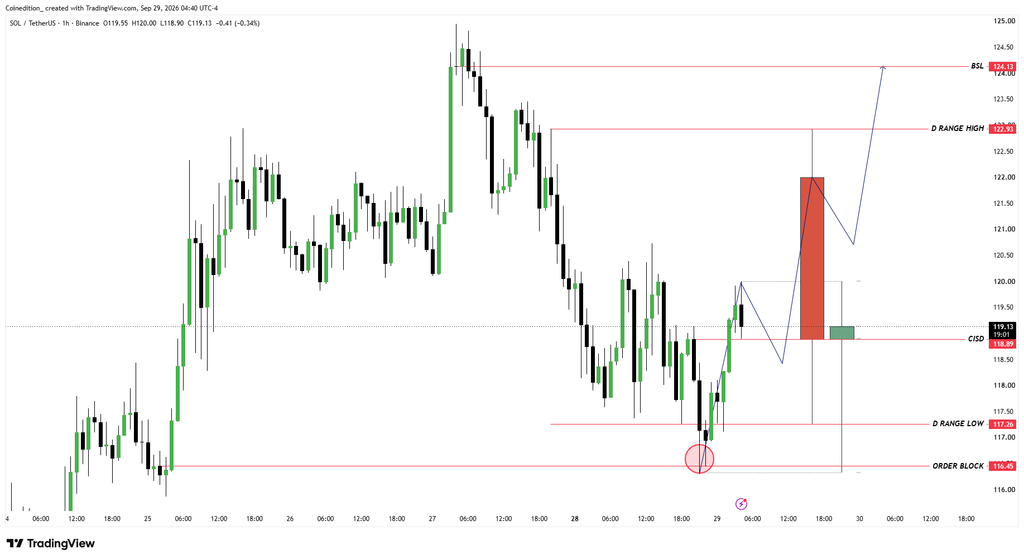
Tuesday’s sweep below $117.26 and quick recovery have shifted focus to the $118.89 confirmation level before Solana can challenge $122.93 and $124.13. The move suggests a potential liquidity grab rather than a breakdown, placing the reclaimed range at the center of the next directional test.
Chart Price
Tuesday Signal
CISD Trigger
Upside Reference
$119.13
Potential sell-side sweep
$118.89
$124.13
Tuesday Range Reclaim Puts $124.13 Liquidity in Focus
Solana traded near $119.13 on the supplied one-hour chart after Tuesday moved below Monday’s $117.26 low and then recovered. Monday’s range extends from $117.26 to $122.93. Consequently, Tuesday’s move beneath that boundary created the key liquidity event.
Know when your coins move
Alerts, real-time prices, and market news — all in one app
4.8 based on 40K reviews in the App Store and Google Play
The decline reached the marked $116.45 order block before the price rebounded above Monday’s low. That sequence represents a potential sell-side liquidity sweep rather than sustained acceptance below the previous range.
Source: TradingView
However, recovering $117.26 completes only the first part of the setup. The chart places the CISD trigger at approximately $118.89. Holding that level would provide confirmation rather than anticipation. At press time, $SOL’s price was slightly above $118.89 in the supplied snapshot, making Tuesday’s close the next key test.
$118.89 CISD Confirmation Sets Up the $122.93 Test
A Tuesday close inside Monday’s range would preserve the proposed manipulation structure and keep the opposite side of the range in focus. At the same time, continued acceptance above $118.89 would strengthen the recovery and confirm that buyers are maintaining control above the CISD level.
However, a move above the CISD followed by rejection would weaken the sequence. Once the reclaim is confirmed, Monday’s $122.93 high becomes the first major upside draw. From $119.13, reaching that level would require an advance of approximately 3.2%.
Therefore, if Tuesday closes inside the range while $118.89 remains defended, the mapped rotation could extend toward $122.93 by Wednesday. Conversely, a sustained move below $118.89 would weaken the reclaim, while a break below $117.26 would shift attention back toward the $116.45 order block.
$122.93 Break Exposes $124.13 Buy-Side Liquidity
If the recovery continues, Monday’s $122.93 high becomes the next major hurdle before the higher liquidity target comes into view. The $124.13 buy-side liquidity sits above that level, making it the secondary objective.
The $SOL price would therefore need to rotate through Monday’s range and clear its upper boundary first. From the chart price of $119.13, a move to $124.13 represents an advance of roughly 4.2%. As a result, the mapped sequence progresses from $118.89 to $122.93 and then to $124.13.
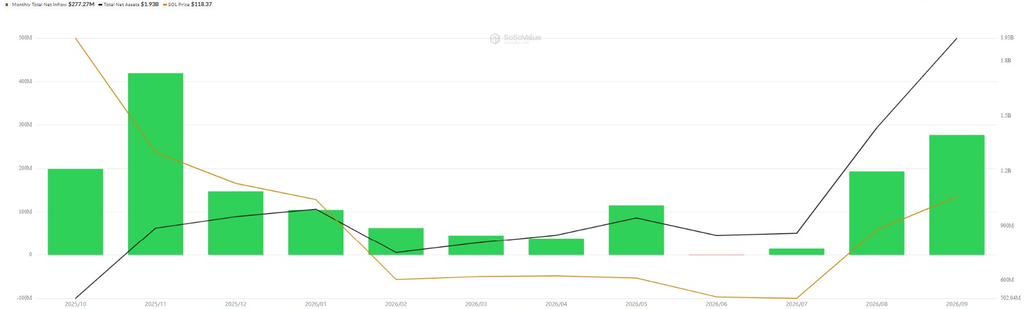
However, that final stage still depends on bullish momentum holding after Monday’s high is cleared. Meanwhile, the technical structure is developing alongside continued accumulation through U.S. spot Solana ETFs.
Source: SoSoValue
Since July 13, those products have accumulated roughly 4.37 million $SOL worth around $450 million, according to the SoSoValue data. That ETF accumulation provides a broader demand backdrop. Even so, the immediate setup continues to depend on Tuesday’s close and sustained acceptance above $118.89.
LEVELS THAT DEFINE THE SETUP
Level
Role
$124.13
Buy-side liquidity and continuation reference
$122.93
Monday’s high and first upside draw
$118.89
CISD confirmation level
$117.26
Monday’s range low
$116.45
Order block and downside reference
EXPANSION CASE
A Tuesday close inside Monday’s range while $118.89 holds would preserve the manipulation setup. That would keep $122.93 first, with $124.13 becoming the next reference if Monday’s high breaks.
FAILURE CASE
A sustained reversal below $118.89 would weaken the reclaim and reduce the strength of the immediate bullish setup. Moreover, if $SOL loses $117.26, attention would shift back toward the $116.45 order block.
BOTTOM LINE
Tuesday’s sweep below $117.26 and rebound from $116.45 created the potential range-manipulation structure shown on the one-hour chart. Yet, confirmation still requires a close inside Monday’s range and continued acceptance above $118.89. If those conditions hold, $122.93 remains the first target before $124.13 becomes the next liquidity reference into Wednesday.
FAQs
1. What confirms the setup?
A close inside Monday’s range while $118.89 holds provides confirmation rather than anticipation.
2. What is the first upside objective?
Monday’s $122.93 high is the first major draw.
3. Where is the continuation reference?
The chart marks buy-side liquidity at $124.13 above Monday’s high.
4. What weakens the setup?
A move below $118.89 weakens the reclaim, while a move below $117.26 redirects attention toward $116.45.
5. Why do ETF holdings matter?
They show roughly 4.37 million $SOL worth about $450 million accumulated through U.S. spot products since July 13.
Related: Ethereum Price LIVE: Liquidity Shakeout Could Fuel Short Squeeze to $2,789

 coinedition.com