Peter Brandt’s New XRP Chart Links Two Historic Breakouts to XRP’s Current Setup
thecryptobasic.com
18 h
Peter Brandt says $XRP’s charts alone provide reason to consider a trade, as a potential inverse head-and-shoulders pattern forms near the $1.50-$1.55 neckline.
Veteran trader Peter Brandt has again turned his attention to $XRP, saying the crypto price charts alone are enough to justify considering a trade, despite his previous skepticism toward $XRP’s fundamental valuation.
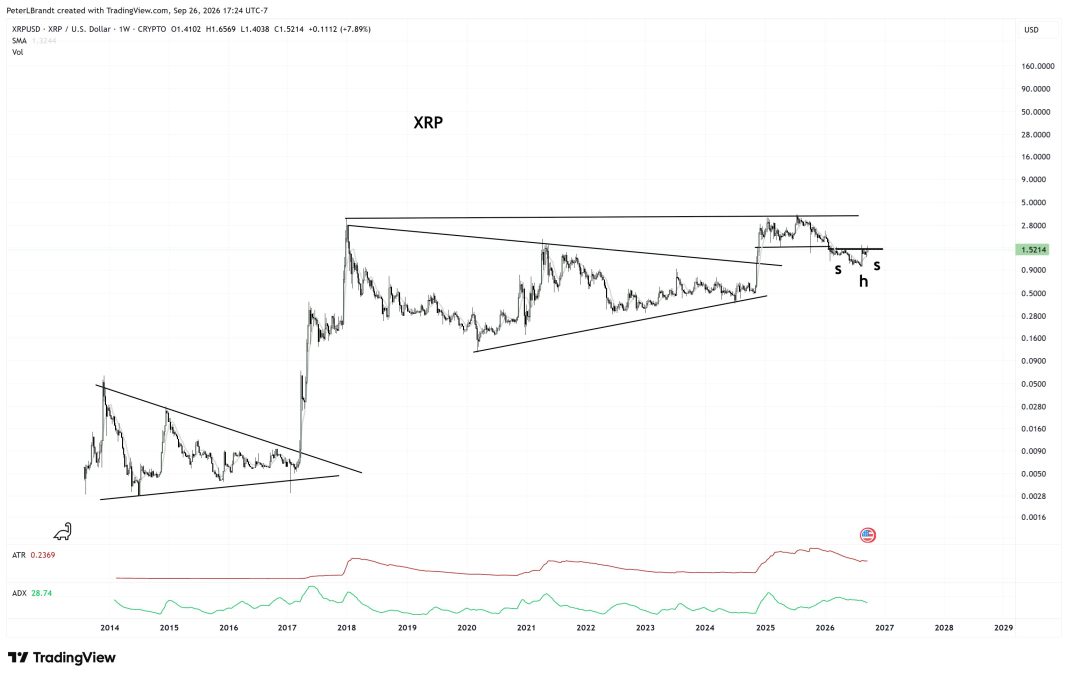
His latest weekly chart highlights a possible inverse head-and-shoulders structure near $1.52 while also placing the current setup within more than a decade of $XRP price history.
More Than Just News Content, live market tracking, portfolio management, and price alerts — everything you need in the Crypto News app. Download now, stay on top of the crypto market, and take control of your information.
Peter Brandt’s weekly $XRP chart highlights two historical multi-year breakout structures and a potential inverse head-and-shoulders formation near $1.52. $XRP is testing a neckline around $1.50-$1.55, while the chart’s ADX stands at 28.74 and weekly SMA near $1.3244. Source: Peter Brandt/TradingView.
Brandt said investors do not need to become what he called a “certified cult member” to be interested in $XRP, adding that “the charts alone have always been enough reason for us to make a bet.” He then distinguished between keeping an open mind and following an asset without sufficient judgment.
Brandt’s chart places $XRP at approximately $1.5214, after a weekly candle that opened at $1.4102, reached $1.6569, and gained 7.89%. The token is also trading above the chart’s weekly simple moving average near $1.3244.
The most immediate structure appears on the right side of the chart, where Brandt labels three recent lows “s,” “h,” and “s”—shoulder, head, and shoulder.
This resembles an inverse head-and-shoulders formation, with a horizontal neckline sitting around the $1.50-$1.55 region. $XRP is currently testing this neckline rather than trading decisively above it.
Under classical chart analysis, the pattern would require a sustained break above the neckline before being considered confirmed. $XRP has already traded as high as $1.6569 during the latest weekly candle, but the chart’s closing reference remains near $1.52.
Using the approximate distance between the head around the $0.95-$1 region and the neckline near $1.52 produces a conventional measured-move area around $2.05-$2.10 if the structure confirms. This is a technical calculation from the pattern, not a target stated on Brandt’s chart.
Brandt’s Chart Also Tracks Two Major $XRP Breakouts
The chart does not focus only on the latest formation.
On the far left, $XRP’s price action between roughly 2014 and 2017 shows a tightening structure formed by descending resistance and rising support. $XRP eventually broke out of that formation during the 2017 market expansion.
A much larger structure followed after $XRP’s 2018 peak.
Brandt draws a descending upper trendline extending from the 2018 high and a rising lower trendline beginning around the 2020 period. These boundaries converged for several years before $XRP eventually broke above the descending resistance during its late-2024 rally. HTLtCe6WcAE2mZY
After that breakout, $XRP advanced into a broad range whose upper boundary sits around the $3.30-$3.40 area. The token has since retraced toward the lower part of this post-breakout range, creating the smaller shoulder-head-shoulder structure now highlighted on the chart.
This makes the $1.50-$1.55 zone important twice: it is both the immediate neckline of the possible inverse head-and-shoulders pattern and a horizontal level $XRP is attempting to reclaim after its 2026 decline.
ADX Shows $XRP Remains in a Meaningful Trend
Brandt’s chart also displays an ADX reading of 28.74.
ADX measures the strength of a trend rather than whether that trend is bullish or bearish. Readings above 25 are commonly associated with a market showing meaningful directional strength.
The chart’s ATR stands at 0.2369, representing roughly 15.6% of $XRP’s $1.5214 reference price. This indicates that weekly price ranges remain relatively wide. HTLtCe6WcAE2mZY
Brandt Previously Questioned $XRP’s Fundamental Valuation
Brandt’s latest chart-based interest comes after much more skeptical remarks about $XRP’s fundamentals.
During a recent Cointelegraph interview, Brandt acknowledged that $XRP “can be effectively used for transactional purposes cheaply.” However, he argued that transactional utility alone does not automatically mean an asset should become more valuable. Pasted text
He separated $XRP’s transactional role from Bitcoin’s store-of-value thesis and Ethereum’s ability to support applications and other functionality. Pasted text
His latest comments therefore draw a distinction between fundamental conviction and technical trading. Brandt is not presenting the chart as proof of $XRP’s underlying valuation; rather, he is saying that its price structure alone can provide a reason to consider a trade.
Brandt has also previously mapped an eventual $XRP advance toward $5.40, although that separate projection did not include a specific deadline and did not confirm that he had opened a position. TokenPost
For the current weekly setup, the first technical hurdle remains the $1.50-$1.55 neckline area. A sustained move above it would confirm more of the inverse head-and-shoulders structure, while failure to hold the area would leave $XRP inside its broader consolidation.

 thecryptobasic.com