
 ambcrypto.com
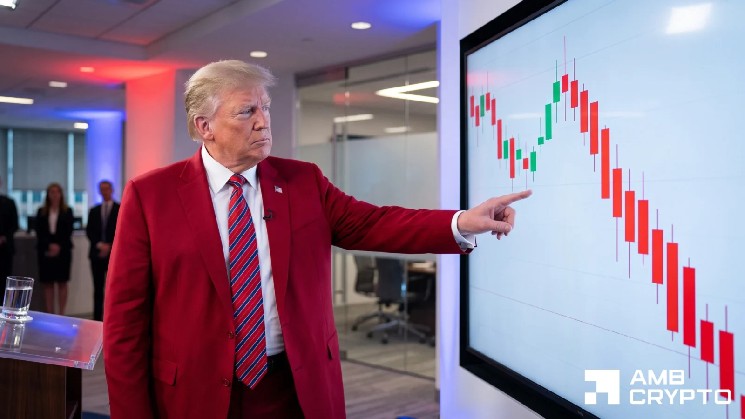
Official Trump [$TRUMP] has been on the decline, losing 10% in the last day as of writing, a turn around from the accumulated 34% gain over the past month.
While its recent performance paints a bleak outlook, the chart shows that $TRUMP could still rebound. The price decline has further pushed the asset into a possible demand zone on the chart.
This level has previously acted as resistance against the price, forcing it lower on three separate occasions as the asset recorded significant losses. In fact, the last time it traded into the zone, it shed roughly 32%, forming its August low.
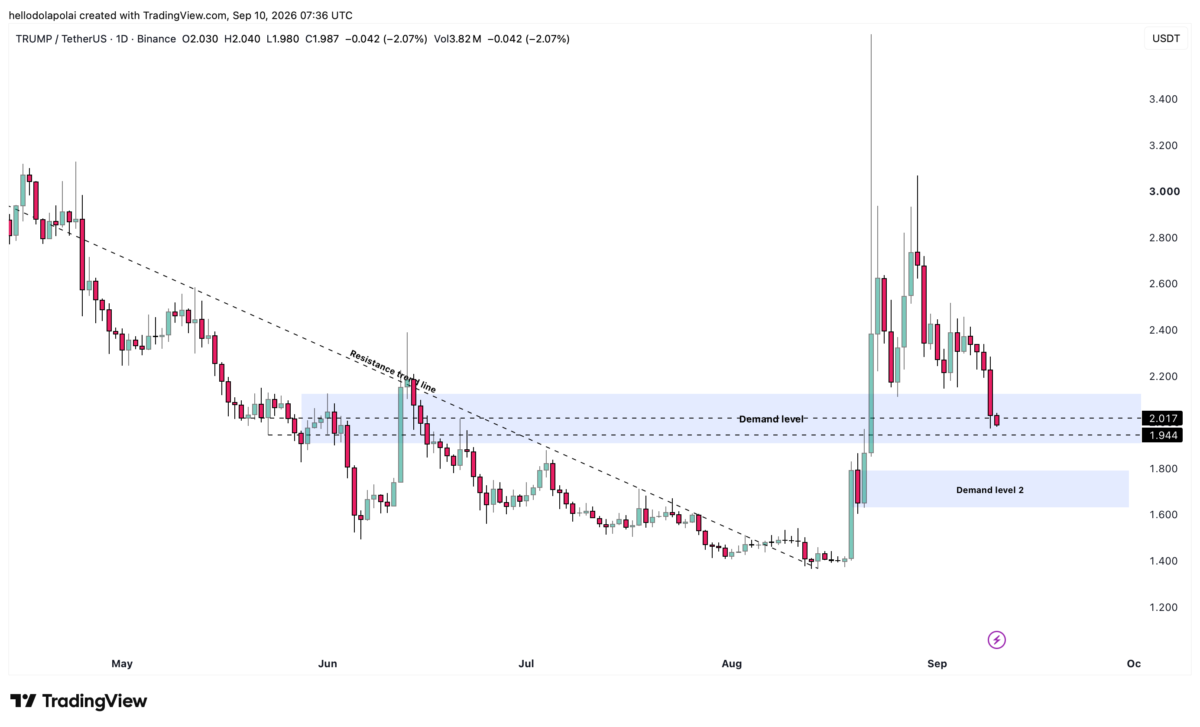
Trading within this level could potentially provide a rebound, causing the asset to move back into higher territory, with targets around the $3.00 to $3.40 levels, according to the chart.
However, if the zone fails to hold the asset, the price is likely to plummet, reaching somewhere around the level marked Demand Zone 2, which could potentially provide another rebound.
What is $TRUMP crypto’s directional bias?
The Bollinger Bands, an indicator used to identify undervaluation and overvaluation on the chart, show that the market is presently undervalued.
The price enters the undervalued zone when it drops into the red level of the Bollinger Bands, and previous moves into this zone have triggered rallies.
The most recent instance, where the price dropped to the red band on the 18th of August, led to $TRUMP setting a new local high at the $3.66 level on the chart, a level last reached on the 18th of March, 2026.
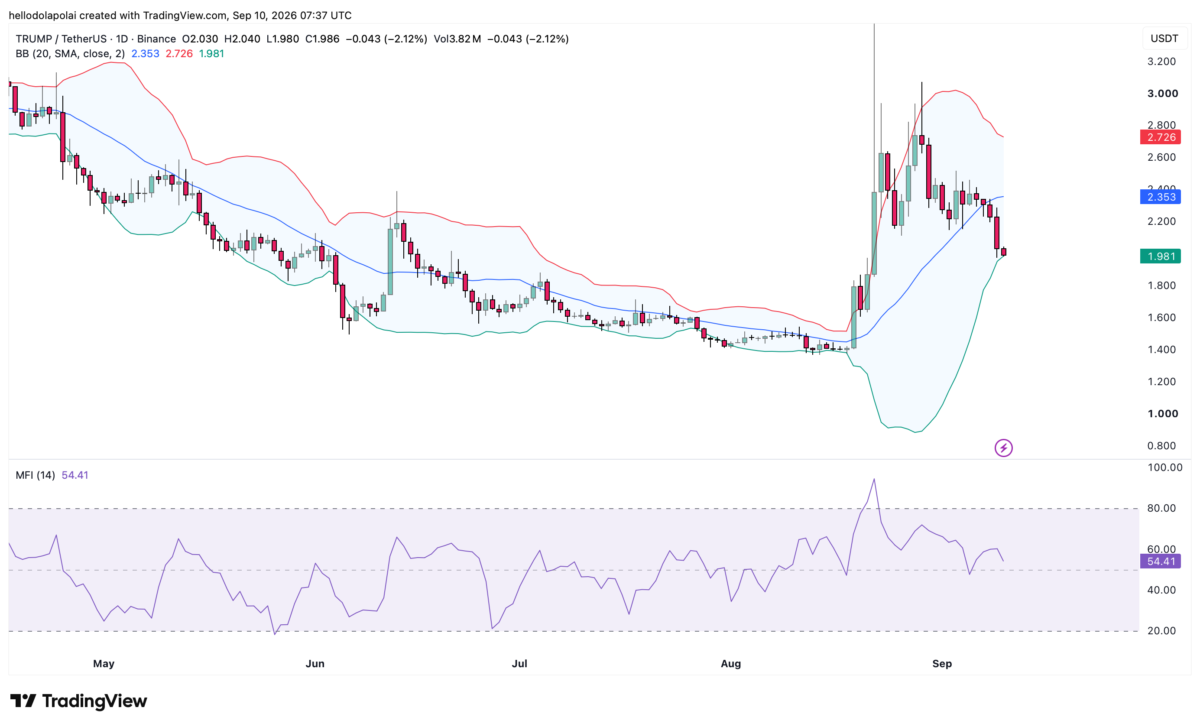
If this becomes a fractal, then there is a high chance that the price rallies, reaching a high between $2.35, the band level, or extending further up to $2.72.
At this point, the rally depends on capital flow in the market, while the Money Flow Index (MFI) currently shows a weak capital flow structure.
The MFI basically measures capital inflows and outflows from an asset. An MFI reading between 50 and 80 suggests that investors in the market are overall bullish, and at the moment, there is a reading of 54.41 on the chart.
What is more notable is that the MFI is trending downward, indicating that capital is already exiting the market gradually.
Capital concentration in shorting price
There has been a notable concentration in the perpetual market from the number of short contracts in the market.
The Open Interest (OI) Weighted Funding Rate, which measures the capital concentration in the market compared to positioning on the chart, shows whether there is a long or short bias, with the current reading showing heavy short positioning.
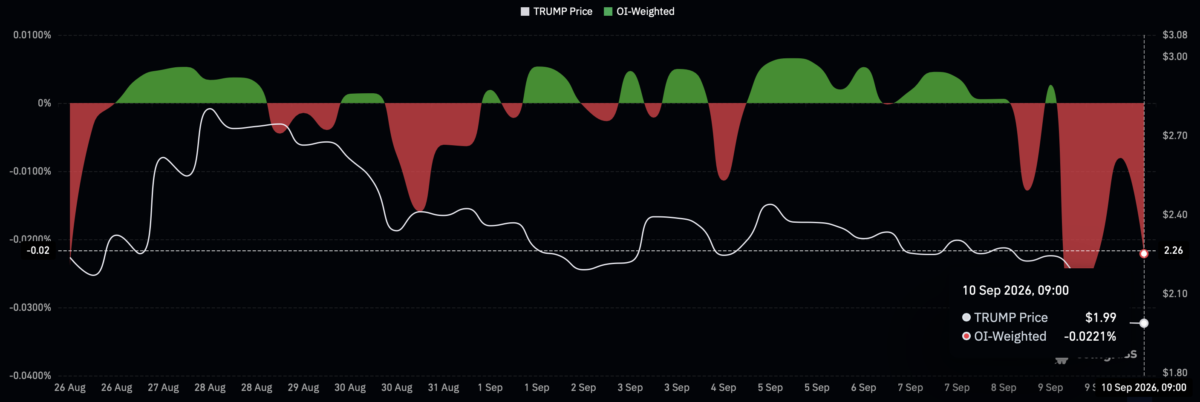
At press time, the OI Weighted Funding Rate has dropped to -0.0221% on the chart, suggesting that there is a heavy concentration of capital in the market. The OI in the perpetual market is presently valued at $175.72 million.
The depth of this concentration shows that there is a heavy tilt in the market that is presently favoring short traders. Until there is a clear catalyst for a rebound, $TRUMP faces further downside risk.
Final Summary
- $TRUMP has entered a key demand zone, where previous price reactions could provide a potential rebound toward $3.00 to $3.40.
- Short positioning is building, with the OI Weighted Funding Rate at -0.0221% and OI at $175.72 million, keeping downside risks elevated.