
 coinedition.com

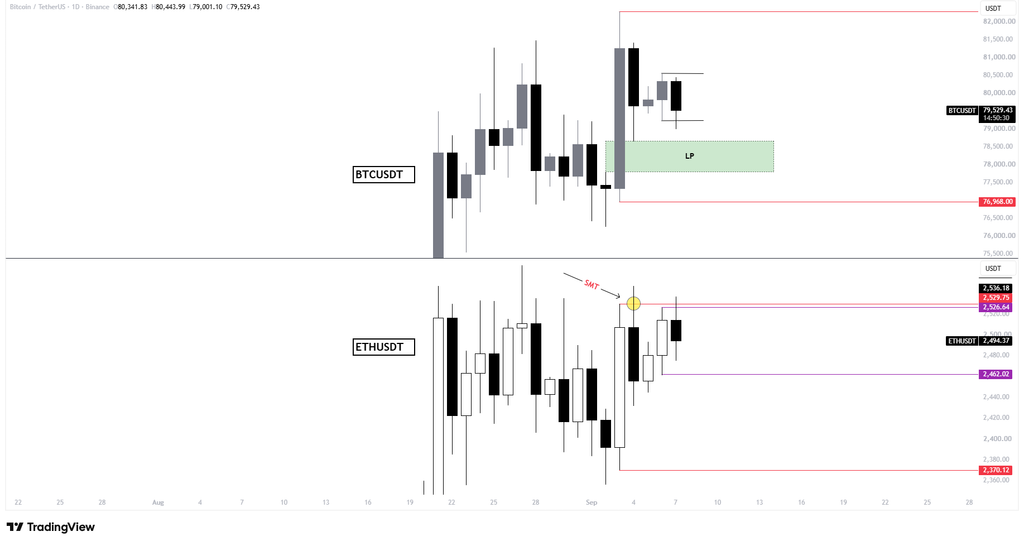
Bitcoin and Ethereum are sending different signals, and that difference is a warning for Bitcoin bulls. Bitcoin recently bounced after taking sell-side liquidity, showing short-term strength.
Ethereum, however, already moved above its range high and took the buy-side liquidity around $2,526–$2,530 before falling back.
Bitcoin has failed to make the same move.
This creates a bearish SMT divergence between the two cryptocurrencies. Ethereum made a higher high while Bitcoin failed to confirm it. That tells us the recent strength in $BTC is not fully supported by $ETH.
Bitcoin and Ethereum Show Different Strength
Both assets have been trading within clear ranges, but their recent liquidity moves differed. Ethereum pushed above its range high and swept the buy-side liquidity around $2,526–$2,530. It then dropped back below that area and now trades near $2,494.
Bitcoin took the opposite path. $BTC swept sell-side liquidity below its range and then reversed higher, but it has not taken the liquidity above its range high.
That difference is important.
In a healthy move higher, correlated assets usually confirm each other. Here, $ETH has already taken the highs while $BTC has not. This makes the Ethereum move look more like a liquidity grab than the start of a strong breakout.
Bitcoin’s Bullish CRT Is Attracting Longs
Bitcoin’s bullish CRT gives traders a clear reason to buy. $BTC first moved lower, swept sell-side liquidity, and then reversed sharply higher. The move showed that buyers stepped in after the lower liquidity was taken.
$BTC has since recovered toward $80,000, with the price around $79,500.
The bullish setup is simple:
Sell-side liquidity sweep → bullish reversal → move toward the range high.
But this move is also building liquidity. Traders buying the bounce are placing stops below the bullish structure. As more traders enter long positions expecting a breakout, more stop liquidity builds below the market.
If $BTC fails at the range high and turns lower, those long positions become fuel for the next move down. The bullish CRT therefore confirms that buyers defended the lows. It does not confirm that buyers have enough strength to break the highs.
$82,793 Is the Key Resistance
Bitcoin is also approaching a major resistance level at $82,793. Reuters identified this level as important because it lines up with the May high and the 61.8% Fibonacci retracement.
A strong break above $82,793 and a sustained move above it would strengthen the bullish case. Until that happens, Bitcoin remains vulnerable to rejection near the highs.
Downside Levels to Watch
If the bullish structure breaks, the main levels are:
- $BTC: $78,660
- $BTC: $76,968
- $ETH: $2,462
- $ETH: $2,431
A break below $78,660 would weaken Bitcoin’s bullish structure and signal that the recent bounce is losing control. A move below $76,968 would provide stronger confirmation that $BTC is heading back toward lower liquidity. For Ethereum, a break below $2,462 puts $2,431 in focus.
In sum, Bitcoin’s bounce remains bullish in the short term, but the bearish SMT with Ethereum is a clear warning.
Related: Bitcoin Price Prediction: Can $BTC Clear $82,800 to End Bear Market Talk?