
 coinpaper.com

Solana is showing early signs of a potential trend reversal after reclaiming the $100 area, with weekly momentum indicators improving and long-term cycle analysis pointing to a much larger upside scenario. Two separate charts suggest $SOL may be moving out of a prolonged bottoming phase, although confirmation still depends on a sustained higher-high and higher-low structure.
Solana’s Long-Term Cycle Chart Maps a Potential Path Toward $1,000
Solana’s broader market structure is being interpreted as a transition from accumulation and manipulation into a possible expansion phase, with CryptoCurb projecting a long-term move toward $1,000 if the current setup resolves bullishly.
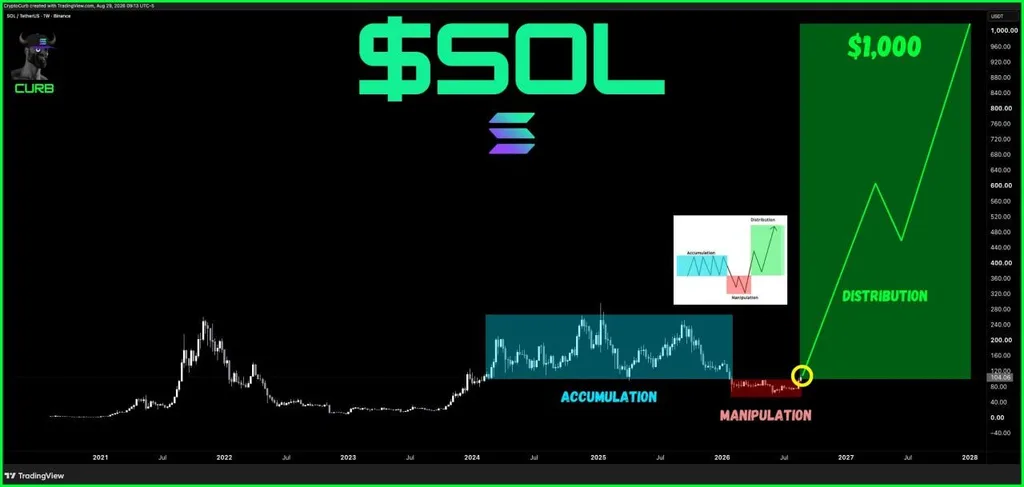
Solana $SOL $1,000 Market Cycle Projection. Source: CryptoCurb (@CryptoCurb) on X
The weekly $SOL/USDT chart separates the market into three phases: accumulation, manipulation and distribution. The accumulation zone covers much of 2024 and 2025, when $SOL traded inside a broad range following its recovery from earlier cycle lows.
The chart labels the subsequent decline into 2026 as a manipulation phase, with $SOL falling below the lower boundary of the previous range before beginning to stabilize near the $100 area. CryptoCurb’s thesis is that this breakdown represents a shakeout rather than the start of another prolonged bearish cycle.
The immediate technical challenge is a sustained recovery above the lower portion of the former range. $SOL is shown near $104, making the roughly $110-$120 region an important early resistance zone. A decisive reclaim would strengthen the case that the breakdown has failed and that price is transitioning back into expansion.
The projected path becomes much more aggressive after that point. The chart shows $SOL potentially advancing toward roughly $600, correcting toward the mid-$400s and later extending toward $1,000 around 2028.
That $1,000 level remains a speculative long-term scenario rather than a confirmed target. The chart does not establish it through a measured move or another independent technical calculation. The bullish case therefore depends first on $SOL reclaiming its former range and later breaking above the major highs formed during the 2024-2025 structure.
$SOL Weekly Chart Flashes Bullish Divergence and Fresh Buy Signals
A second weekly chart from Jesse Olson strengthens the shorter-term reversal case, showing improving momentum alongside a strong weekly candle and several bullish technical signals.
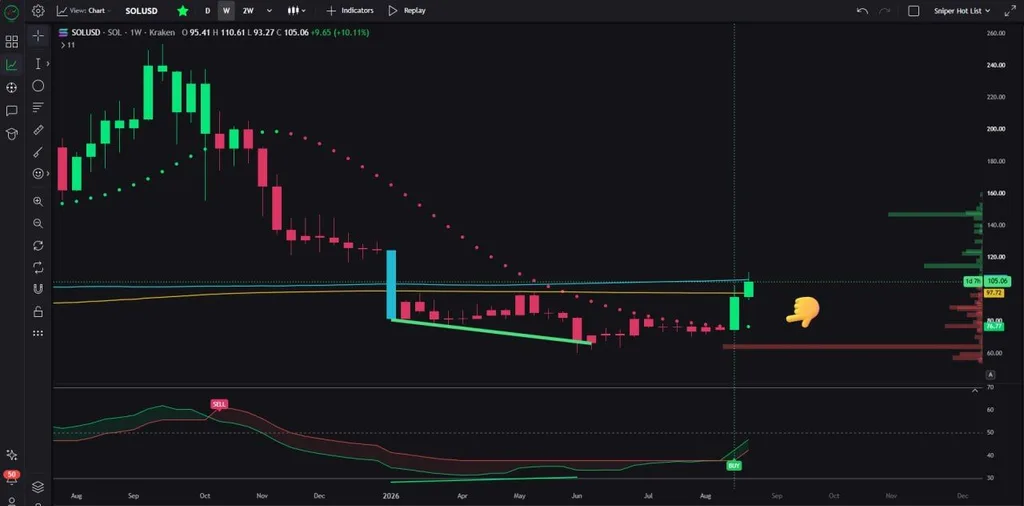
Solana $SOL Weekly Bullish Reversal Signals. Source: Jesse Olson (@JesseOlson) on X
The Kraken $SOL/USD chart shows $SOL at $105.06 after opening the week at $95.41, reaching $110.61 and trading as low as $93.27. That represents a weekly gain of about 10.1% at the time shown on the chart.
Olson highlights a sequence of bullish signals that includes bullish divergence, a buy signal, an RSI-related buy signal and a newly printed green trending dot. The appearance of the green dot is notable because it follows an extended series of bearish trend markers, indicating that momentum conditions may be shifting.
Price has also moved above a visible reference level near $97.72 and is testing the $105-$110 area. A clean move above that zone would improve the short-term structure and increase the probability of a higher high.
The next confirmation would be a higher low after any pullback. That combination would provide stronger evidence that $SOL is transitioning from a downtrend into a developing uptrend rather than simply experiencing another relief rally.
The chart also shows a lower reference near $76.77, which acts as an important invalidation area for the developing bullish structure. A sustained move back below that level would weaken the reversal case.
Above current prices, the visible volume profile suggests additional resistance around $115-$125, followed by a heavier supply zone near $145-$150. Clearing those levels would provide stronger technical confirmation that the bottoming process has progressed into a broader recovery.