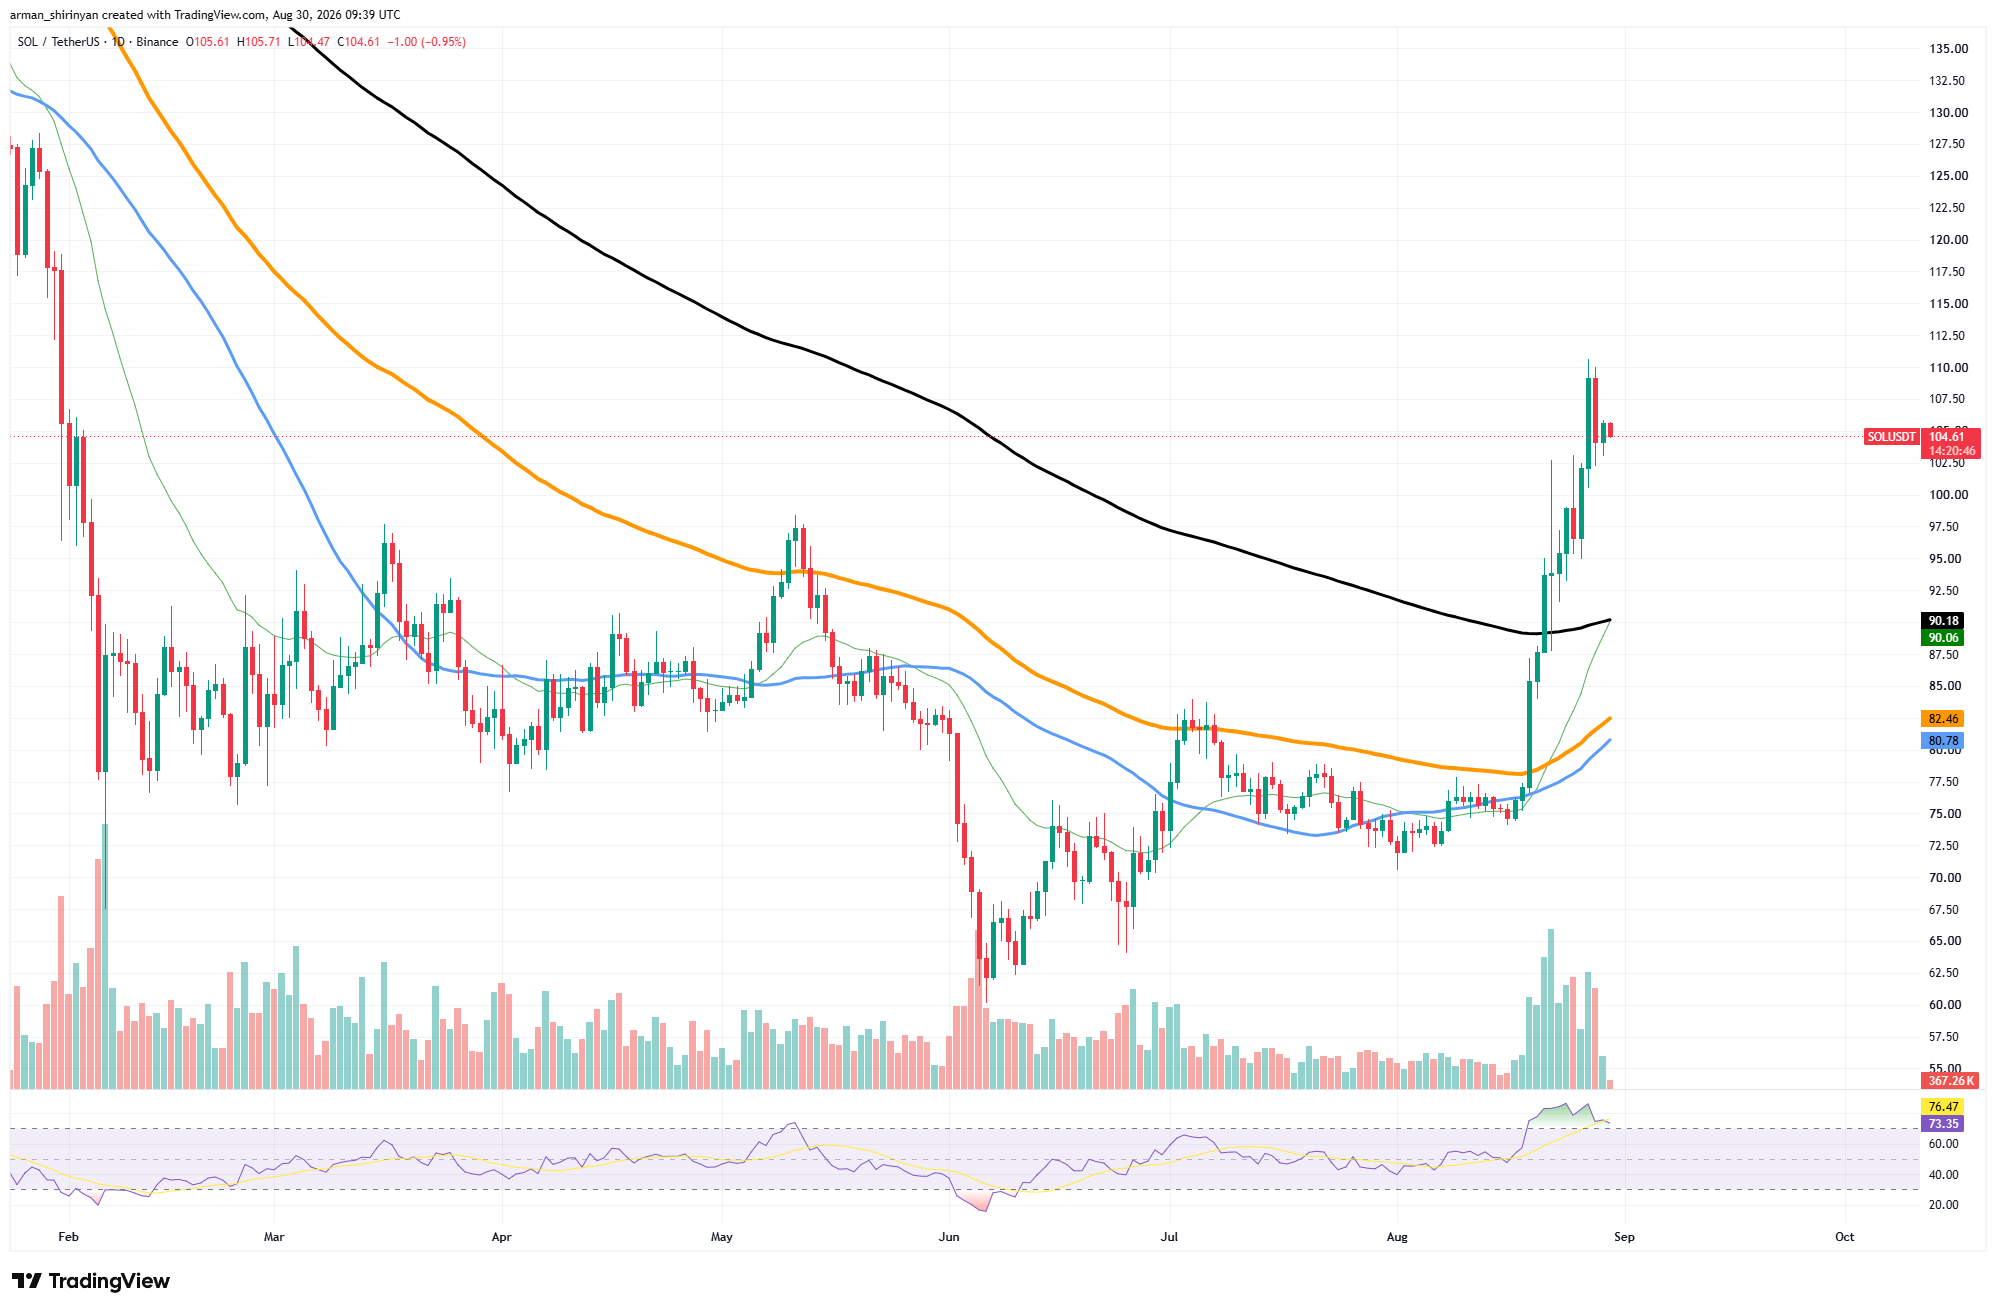
Currently, the 20-day EMA and 200-day moving average are at roughly $90.06 and $90.18, respectively. Solana punched straight through the 200-day average on increasing volume rather than being rejected right away. The current price is over 15% higher than that indicator.
When evaluated from a relative technical perspective, this gives $SOL a stronger technical foundation than assets that stay stuck below their long-term trend resistance, such as Hyperliquid. Instead of breaking its 200-day average, Solana must now defend it. However, there is a clear immediate issue.
Solana being pushed
During the breakout, $SOL experienced severe overbought conditions. The daily RSI rose above 80 before falling to about 73.4. Although momentum is still very strong, chasing the asset between $105 and $110 is much riskier than it was between $80 and $90. Following the breakout burst, volume is also starting to return to normal. Because of this, consolidation is more likely.
The recent peak between $110 and $111 continues to be the first immediate obstacle. Breaking it would allow $SOL to compete in the $115–$120 range. A retracement toward $100 and then the critical $90 area could occur if the price does not keep rising. The current technical line in the sand is that $90 area.
A successful retest would bolster the claim that Solana has entered a true trend reversal and verify that previous long-term resistance has turned into support. Thus, $SOL's current advantage is structural: the challenging breakout has already taken place. The next question is whether buyers will be able to hold it.

 u.today