
 en.cryptonomist.ch

Coinbase Global, Inc. stock surged sharply, closing at $160.20 as Bitcoin passed $71,000 and short liquidations accelerated. News that CEO Brian Armstrong would meet President Trump over digital-asset regulation added fuel. The key question is whether this marks a real trend shift or a violent bounce inside a bearish structure.
Key takeaways
- Coinbase closed at $160.20 after trading between $147.50 and $165.74 in a single session.
- Bitcoin’s push past $71,000 and short liquidations helped drive crypto-linked equities sharply higher.
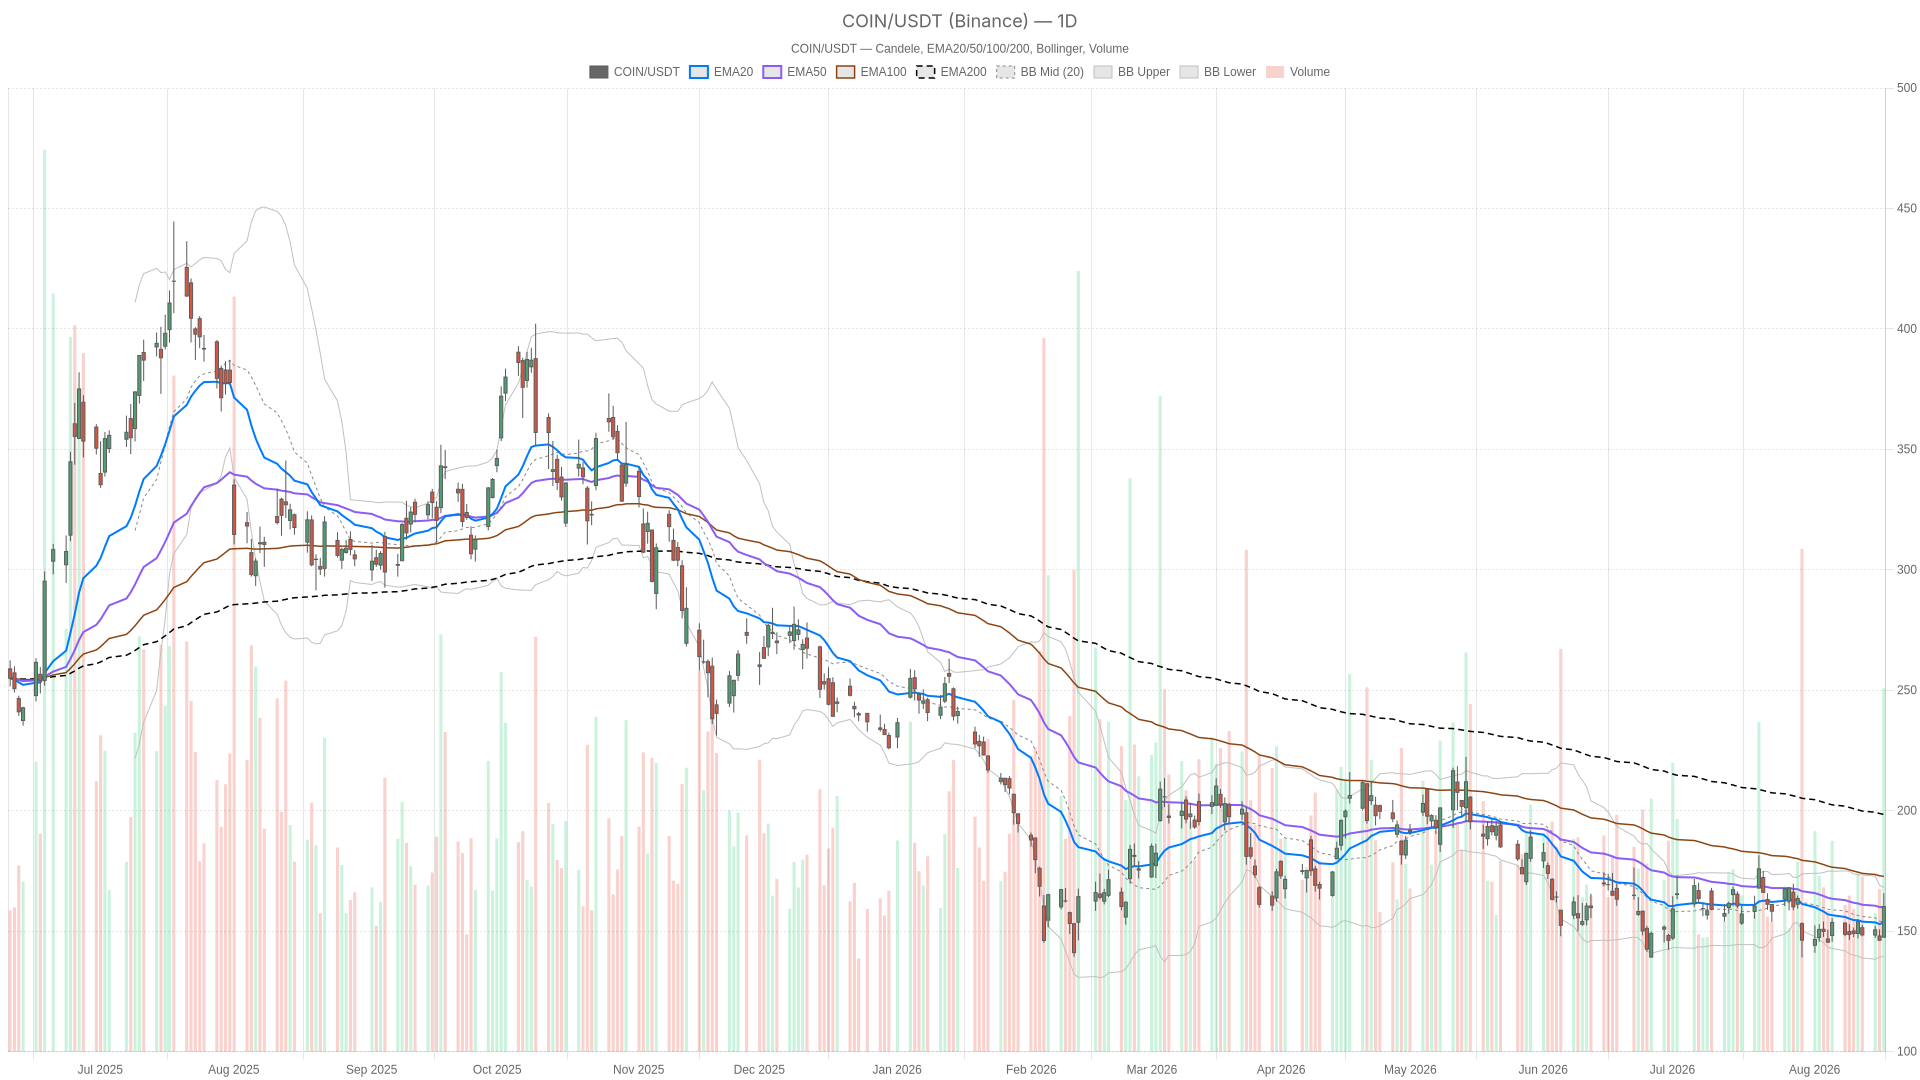
- The daily trend remains neutral: price sits just below the 50-day EMA at $160.01 and far below the 200-day EMA at $198.45.
- The 1-hour chart confirms tactical strength, with price above the 20-, 50-, and 200-hour EMAs.
- A daily ATR14 of 8.86 signals that elevated volatility is likely to persist.
Daily Structure: Coinbase Stock Remains Neutral, But Momentum Is Turning
Coinbase Global, Inc. stock is still technically bearish on the daily chart, but short-term momentum is improving. Price closed at $160.20, above the 20-day EMA at 153.62 but just below the 50-day EMA at 160.01. It remains far beneath the 200-day EMA at 198.45. That gap tells the real story: the broader daily trend has not yet turned bullish. The daily regime reading is labeled neutral, which fits a market that staged a strong recovery without reclaiming its longer-term uptrend.
RSI14 sits at 53.79, essentially neutral with a slight bullish tilt. It is not overbought, leaving room for further upside without an immediate exhaustion signal. Meanwhile, MACD is more interesting. The line is at -2.56, still below the signal line at -3.22, but the histogram has turned positive at 0.66. In practice, that means bearish momentum is decelerating and a potential crossover is forming, even though the indicator has not fully flipped bullish.
Bollinger Bands add context to the volatility story. The mid-band sits at 153.83, the upper band at 168.07, and the lower band at 139.58. Price closed near the upper half of that range, with an ATR14 of 8.86. That confirms an unusually volatile session by Coinbase’s own recent standards. The daily pivot at 157.81 has already been reclaimed. Price now trades between that pivot and resistance at 168.13. Support below sits at 149.89, which bulls need to defend on any pullback.
1H Timeframe: Tactical Strength Confirms the Bounce
The 1-hour chart confirms the bounce as tactically strong. Price at 160.30 is trading above all three key EMAs: the 20-hour at 154.76, the 50-hour at 152.34, and the 200-hour at 155.06. That stacked alignment is a classic short-term bullish signature. RSI14 on the 1H chart reads 62.1, firmly in bullish territory without being stretched into overbought extremes.
MACD on the hourly confirms the same story. The line at 2.88 sits above the signal at 1.81, with a histogram of 1.07. Therefore, active bullish momentum is present rather than just a momentum turn. The 1H timeframe is doing what it should do here: confirming intraday strength behind the rally while the daily chart remains structurally cautious. Price holds above the hourly pivot at 159.46 and presses toward resistance at 161.30. Support down at 158.46 offers a reasonable line in the sand for intraday bulls.
15-Minute Execution Context: A Pause, Not a Reversal
The 15-minute chart shows a pause within strength, not a reversal. On this timeframe, the regime is explicitly tagged bullish, and EMA structure agrees. The 20-period EMA at 159.41 sits above the 50-period at 156.17. That 50-period EMA sits above the 200-period at 151.80. This is a clean bullish stack for short-term traders. However, momentum is cooling at this granular level. MACD on the 15-minute chart shows the line at 1.27 below the signal at 2.03, producing a negative histogram of -0.76.
In other words, the immediate push is losing a bit of steam after the spike, even though the broader short-term trend remains intact. RSI14 at 56.92 is consistent with a pause rather than a reversal. Price sits below the 15-minute Bollinger mid-band at 161.62, with resistance near 166.06. Some digestion is likely before the next directional attempt. The 15-minute pivot at 159.71, alongside resistance at 161.05 and support at 158.95, frames a tight consolidation zone for near-term execution.
The Bullish Case for Coinbase Stock
The bullish case depends on continuation above key daily resistance. If price clears the daily resistance at $168.13 and holds above the 50-day EMA near 160.01, the daily MACD crossover would likely complete. That would shift the broader signal from neutral to constructive. A close above the daily pivot at 157.81 that sustains through subsequent sessions would reinforce the bounce. That would make it more than a one-day liquidation event.
News flow is a genuine tailwind here. Renewed regulatory clarity discussions in Washington, combined with Bitcoin’s push past $71,000, have already moved Coinbase shares by double digits in a single session. Continued strength in Bitcoin and further progress on digital-asset legislation would give bulls the fundamental backdrop to match the technical setup.
The Bearish Case and What Would Invalidate the Rally
On the other hand, the bearish case remains intact as long as price stays far below the 200-day EMA. Coinbase stock remains deeply below its 200-day EMA at 198.45. That gap represents a significant overhead technical burden regardless of how strong the recent bounce looks. A rejection near the upper daily Bollinger band at 168.07 would suggest the rally is running out of room. The same applies if price fails to hold the 50-day EMA at 160.01.
If price slips back below the daily pivot at 157.81 and loses the 20-day EMA at 153.62, support at $149.89 comes back into focus. At that point, the positive MACD histogram on the daily chart would likely fade back into outright bearish territory. The neutral regime label could easily tilt negative. A sharp reversal in Bitcoin or a stall in the regulatory narrative could trigger exactly that kind of pullback. This rally has been highly news-sensitive.
Positioning and Volatility Outlook
Overall, Coinbase Global, Inc. stock sits at a genuine inflection point, with volatility dominating over conviction. The daily trend is neutral with early signs of a momentum shift. The hourly chart confirms tactical strength, while the 15-minute chart shows a brief pause within that strength. At the same time, the long-term technical backdrop, with price still far below the 200-day EMA, keeps the broader bias uncertain.
With an ATR14 of 8.86 on the daily chart, price swings of several dollars per session should be expected. News around Bitcoin’s price action and U.S. regulatory developments will likely continue to drive outsized moves. The daily trend is structurally cautious, while lower timeframes confirm short-term strength. Given those conflicting signals, volatility, not conviction, remains the dominant theme for now.
FAQ
Is Coinbase stock’s daily trend bullish or bearish?
The daily regime is neutral. Price closed at $160.20, above the 20-day EMA at 153.62 but just below the 50-day EMA at 160.01 and far below the 200-day EMA at 198.45. Short-term momentum is improving, but the broader daily trend has not yet turned bullish.
What would confirm a bullish continuation for Coinbase stock?
A move above daily resistance at 168.13 and a sustained hold above the 50-day EMA near 160.01 would support continuation. A completed daily MACD crossover and a close that holds above the daily pivot at 157.81 would reinforce the bounce.
What would invalidate the recent rally?
A rejection near the upper daily Bollinger band at 168.07, combined with failure to hold the 50-day EMA at 160.01, would weaken the bounce. A slip below the daily pivot at 157.81 and the 20-day EMA at 153.62 could open the path toward support at 149.89.
Why did Coinbase stock rally so sharply?
Bitcoin surged past $71,000, short liquidations accelerated, and news emerged that CEO Brian Armstrong was preparing to meet President Trump and White House officials over digital-asset regulation. Strategy, Circle and Robinhood also rallied, with reports citing intraday gains of roughly 9% to 11%.
Disclaimer: This article is for informational purposes only and does not constitute financial advice, an investment recommendation, or a solicitation to buy or sell any financial instrument or cryptocurrency. The analysis provided is not indicative of future results. Investing in crypto assets and financial markets carries a high risk of capital loss. Always do your own research (DYOR) and consult a qualified financial advisor before making any decision.
Article produced with the assistance of artificial intelligence and reviewed by the editorial team.