
 coinpaper.com

Solana has recovered above $73 after rebounding from an intraday low near $70.60, but two market signals question the strength of the move. A reported drop in Bitfinex long positions and weak spot demand leave $SOL vulnerable unless buyers defend support and push through nearby resistance.
Bitfinex Longs Drop, Adding Another Warning Signal for $SOL
A sharp reduction in Bitfinex long positions suggests some leveraged traders have cut their exposure as Solana attempts to hold its latest recovery.
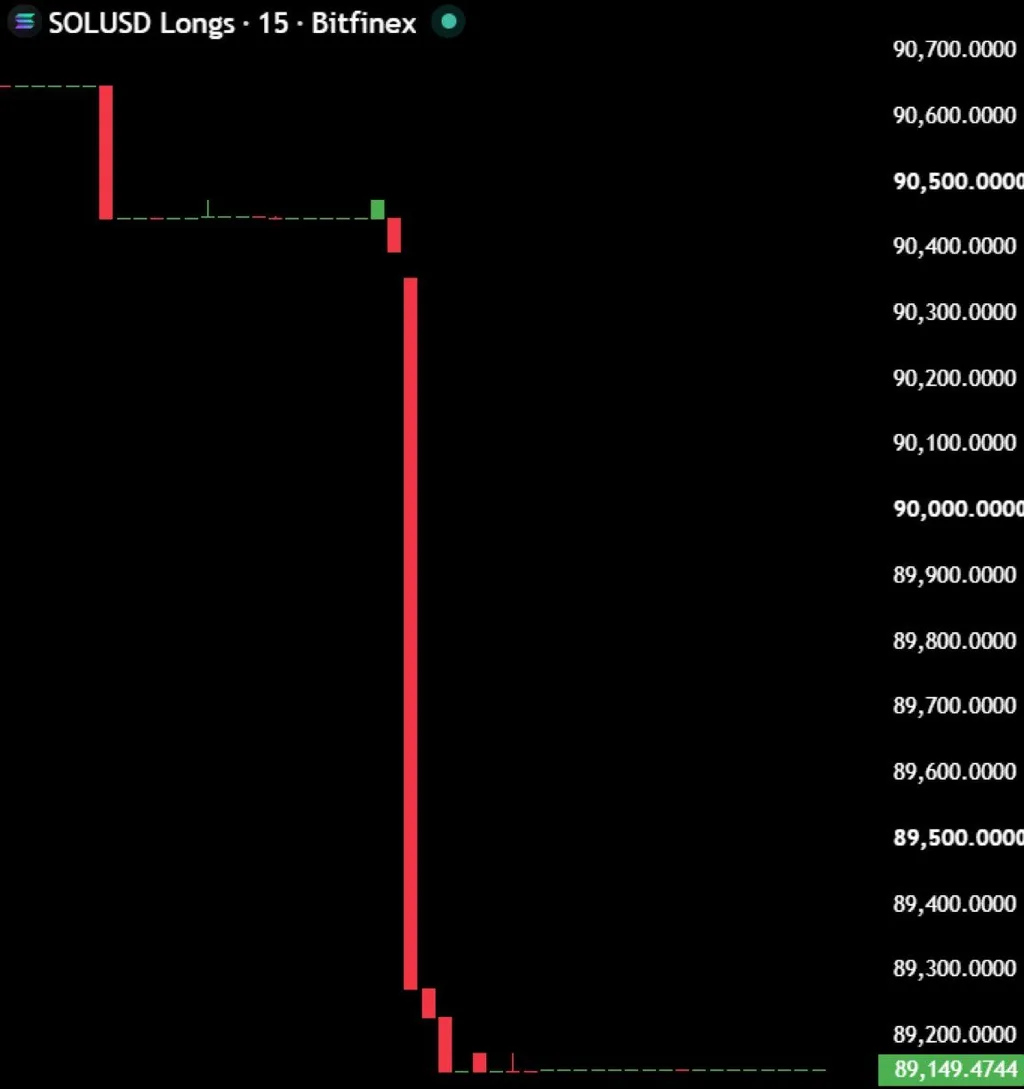
Bitfinex Solana Long Positions Fall Sharply. Source: Crypto King (@CryptoKing4Ever) on X
The post points to a steep decline in $SOL long positions on Bitfinex, indicating that traders using the exchange may have closed bullish bets or reduced leverage. However, the move does not prove that large traders have private information or expect an immediate Solana price decline.
Long positions can fall for several reasons, including profit-taking, risk management, liquidations or traders moving capital elsewhere. The signal therefore needs confirmation from price action and broader market data. Bitfinex provides public statistics for aggregate long and short position sizes, but the supplied post does not specify the size, timing or duration of the reported decline.
Still, the development adds weight to the caution visible in the earlier $SOL/USD chart. Solana rebounded from about $70.60 to above $73, but spot cumulative volume delta remained deeply negative and largely flat. Falling leveraged longs alongside weak spot demand suggests the recovery lacks broad buying conviction.
The bearish scenario would gain credibility if $SOL breaks below its rising intraday trendline and loses the $73 area while Bitfinex long exposure continues to decline. That could open the way toward $72, followed by a possible retest of the recent low near $70.60.
Conversely, the warning would weaken if Solana holds the trendline, clears resistance near $73.50 and attracts renewed spot buying. A rise in spot CVD would provide stronger evidence that real demand, rather than short covering or derivatives activity, is supporting the advance.
Solana Rebounds, but Flat Spot Demand Questions the Rally
Solana recovered from a sharp intraday drop, yet the accompanying spot-market data suggests buyers have not fully supported the move.
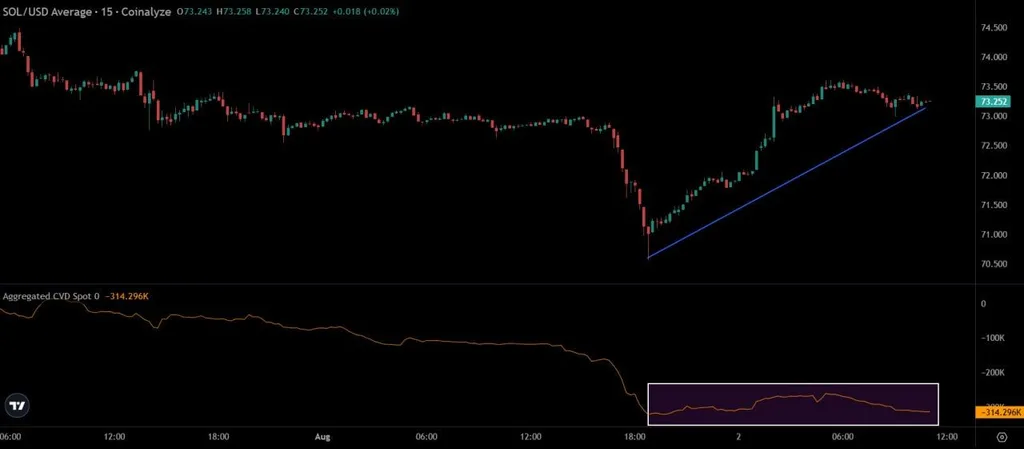
Solana 15-Minute Price Recovery With Flat Spot CVD. Source: Ted (@TedPillows) on X
The 15-minute $SOL/USD chart shows Solana bouncing from roughly $70.60 and climbing back above $73. The recovery formed a sequence of higher lows along the rising blue trendline, indicating that short-term momentum improved after the sell-off.
However, aggregated spot cumulative volume delta, or CVD, remained deeply negative near minus 314,000 and moved mostly sideways during the rebound. Spot CVD tracks the balance between aggressive market buying and selling. When price rises without a similar improvement in this measure, the move may be driven more by derivatives activity, short covering or limited liquidity than by strong spot accumulation.
That divergence is a potential sign of weakness rather than proof that the recovery will fail. Solana must hold the rising trendline and the nearby $73 area to preserve the short-term bullish structure. A break below the trendline would weaken the rebound and could expose lower support around $72, followed by the recent low near $70.60.
On the upside, $SOL needs to clear the local resistance zone around $73.50 with a stronger rise in spot CVD. Improving spot demand would provide better confirmation that buyers are taking control. Until then, the rebound remains constructive but vulnerable to another pullback.