
 coinpaper.com

Solana is holding short-term support and breaking out of a falling wedge, keeping the path toward $79-$81 open. However, the longer-term chart still warns that a bigger rally could become an exit opportunity unless $SOL eventually reclaims $170.
Solana’s Recovery Could Be an Exit Rally Before a Deeper Fall
Solana’s rebound may offer another move toward $120-$170, but the long-term chart still projects a much deeper decline afterward. Analyst Killa argues that heavy token supply and concentrated ownership could limit $SOL’s ability to return to its previous highs.
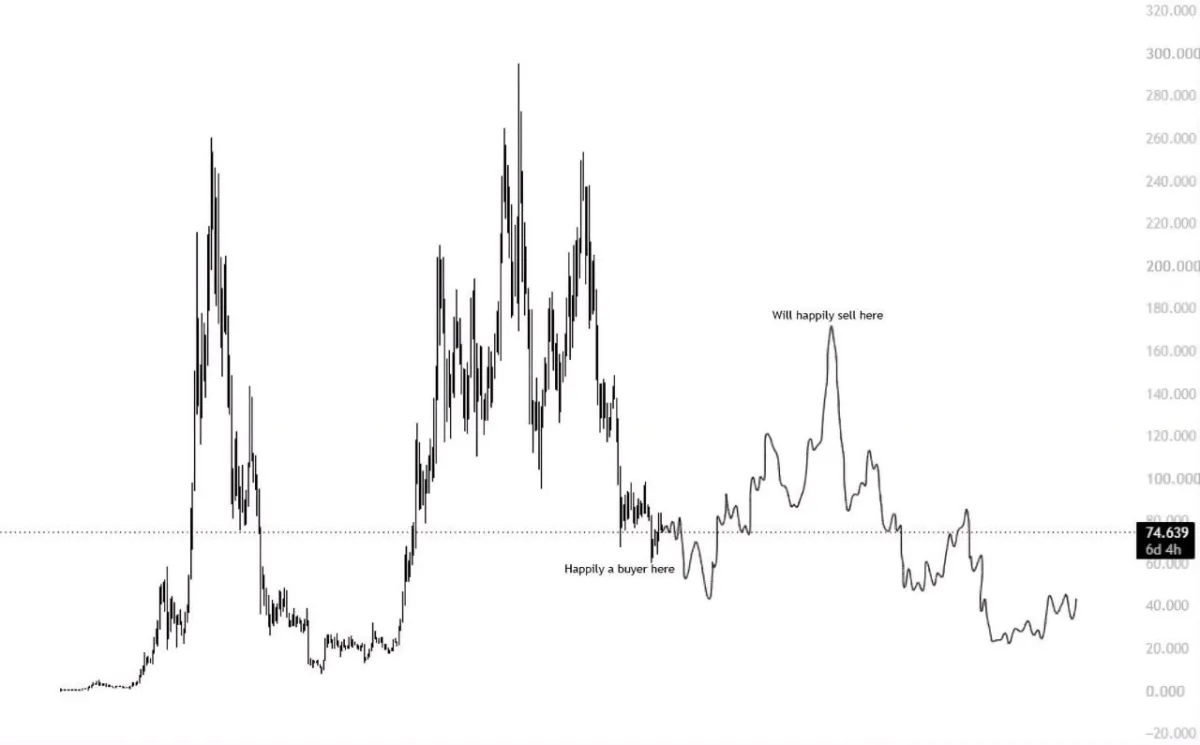
$SOL long-term chart. Source: Killa/X
The projected path treats the current area near $75 as a possible accumulation point for a medium-term trade rather than the beginning of a lasting bull market. A stronger recovery could first reclaim $100 and test the $120-$170 region, where the analyst expects sellers to take control again.
The bearish argument also focuses on future token supply and selling pressure from large holders. However, those claims require separate on-chain evidence; the chart alone cannot prove that insiders or foundations are driving price movements.
Technically, $SOL must hold its current base and form higher lows before the projected recovery becomes credible. A failure to defend the $60-$70 region would weaken the rebound and could bring the lower areas near $40 and eventually $20-$30 into focus.
The outlook would change if Solana breaks above $170 and holds that level as support. Until then, the chart presents the next major rally as a possible exit opportunity rather than a confirmed return to all-time highs.
Solana Breaks Falling Wedge as Buyers Defend Key Support
Solana has broken above a falling wedge after successfully retesting the former resistance zone around $74-$76. The move strengthens the short-term bullish structure and suggests buyers are regaining control.
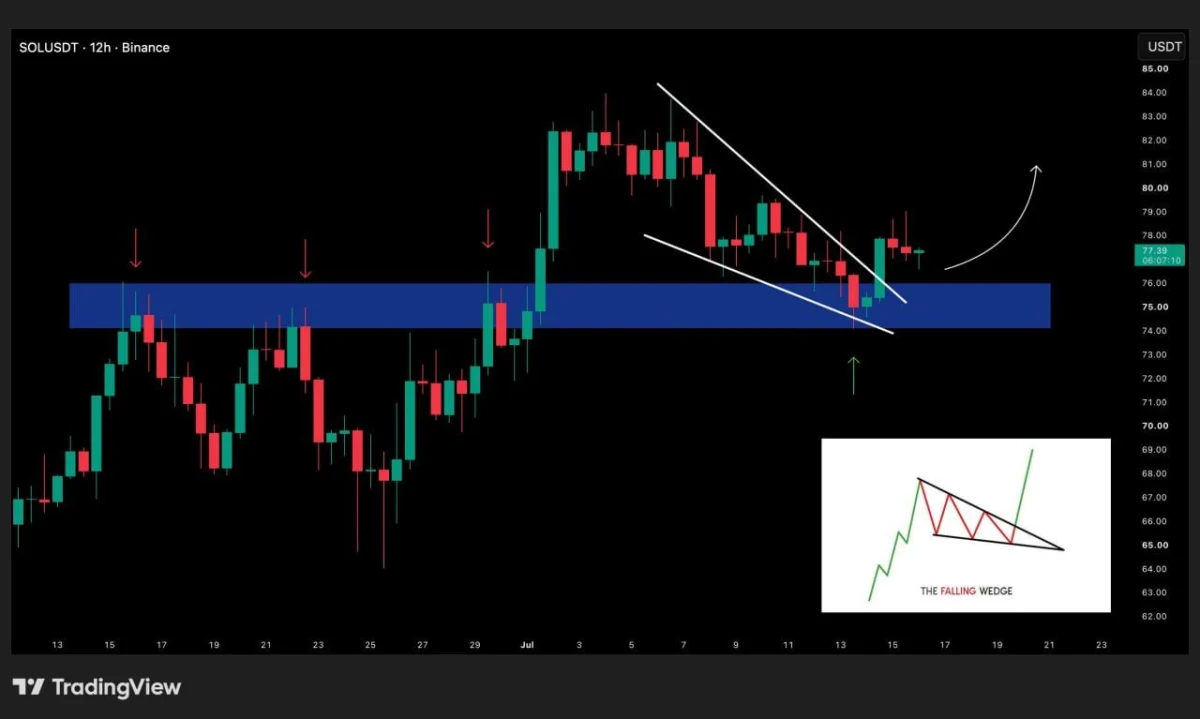
$SOL 12-hour chart. Source: BATMAN/X
The blue zone previously rejected several recovery attempts, but it is now acting as support. Holding above this area confirms a support-resistance flip and reduces the risk that the breakout becomes another temporary bounce.
The falling wedge developed as $SOL formed lower highs and lower lows during its correction from the $83 area. Breaking the upper trendline suggests selling pressure is weakening, with $79-$81 now forming the first important upside target.
However, $SOL must continue closing above the broken trendline and the $74-$76 support zone. A move back below that area would invalidate the breakout and place the lower support levels near $72-$73 back in focus.