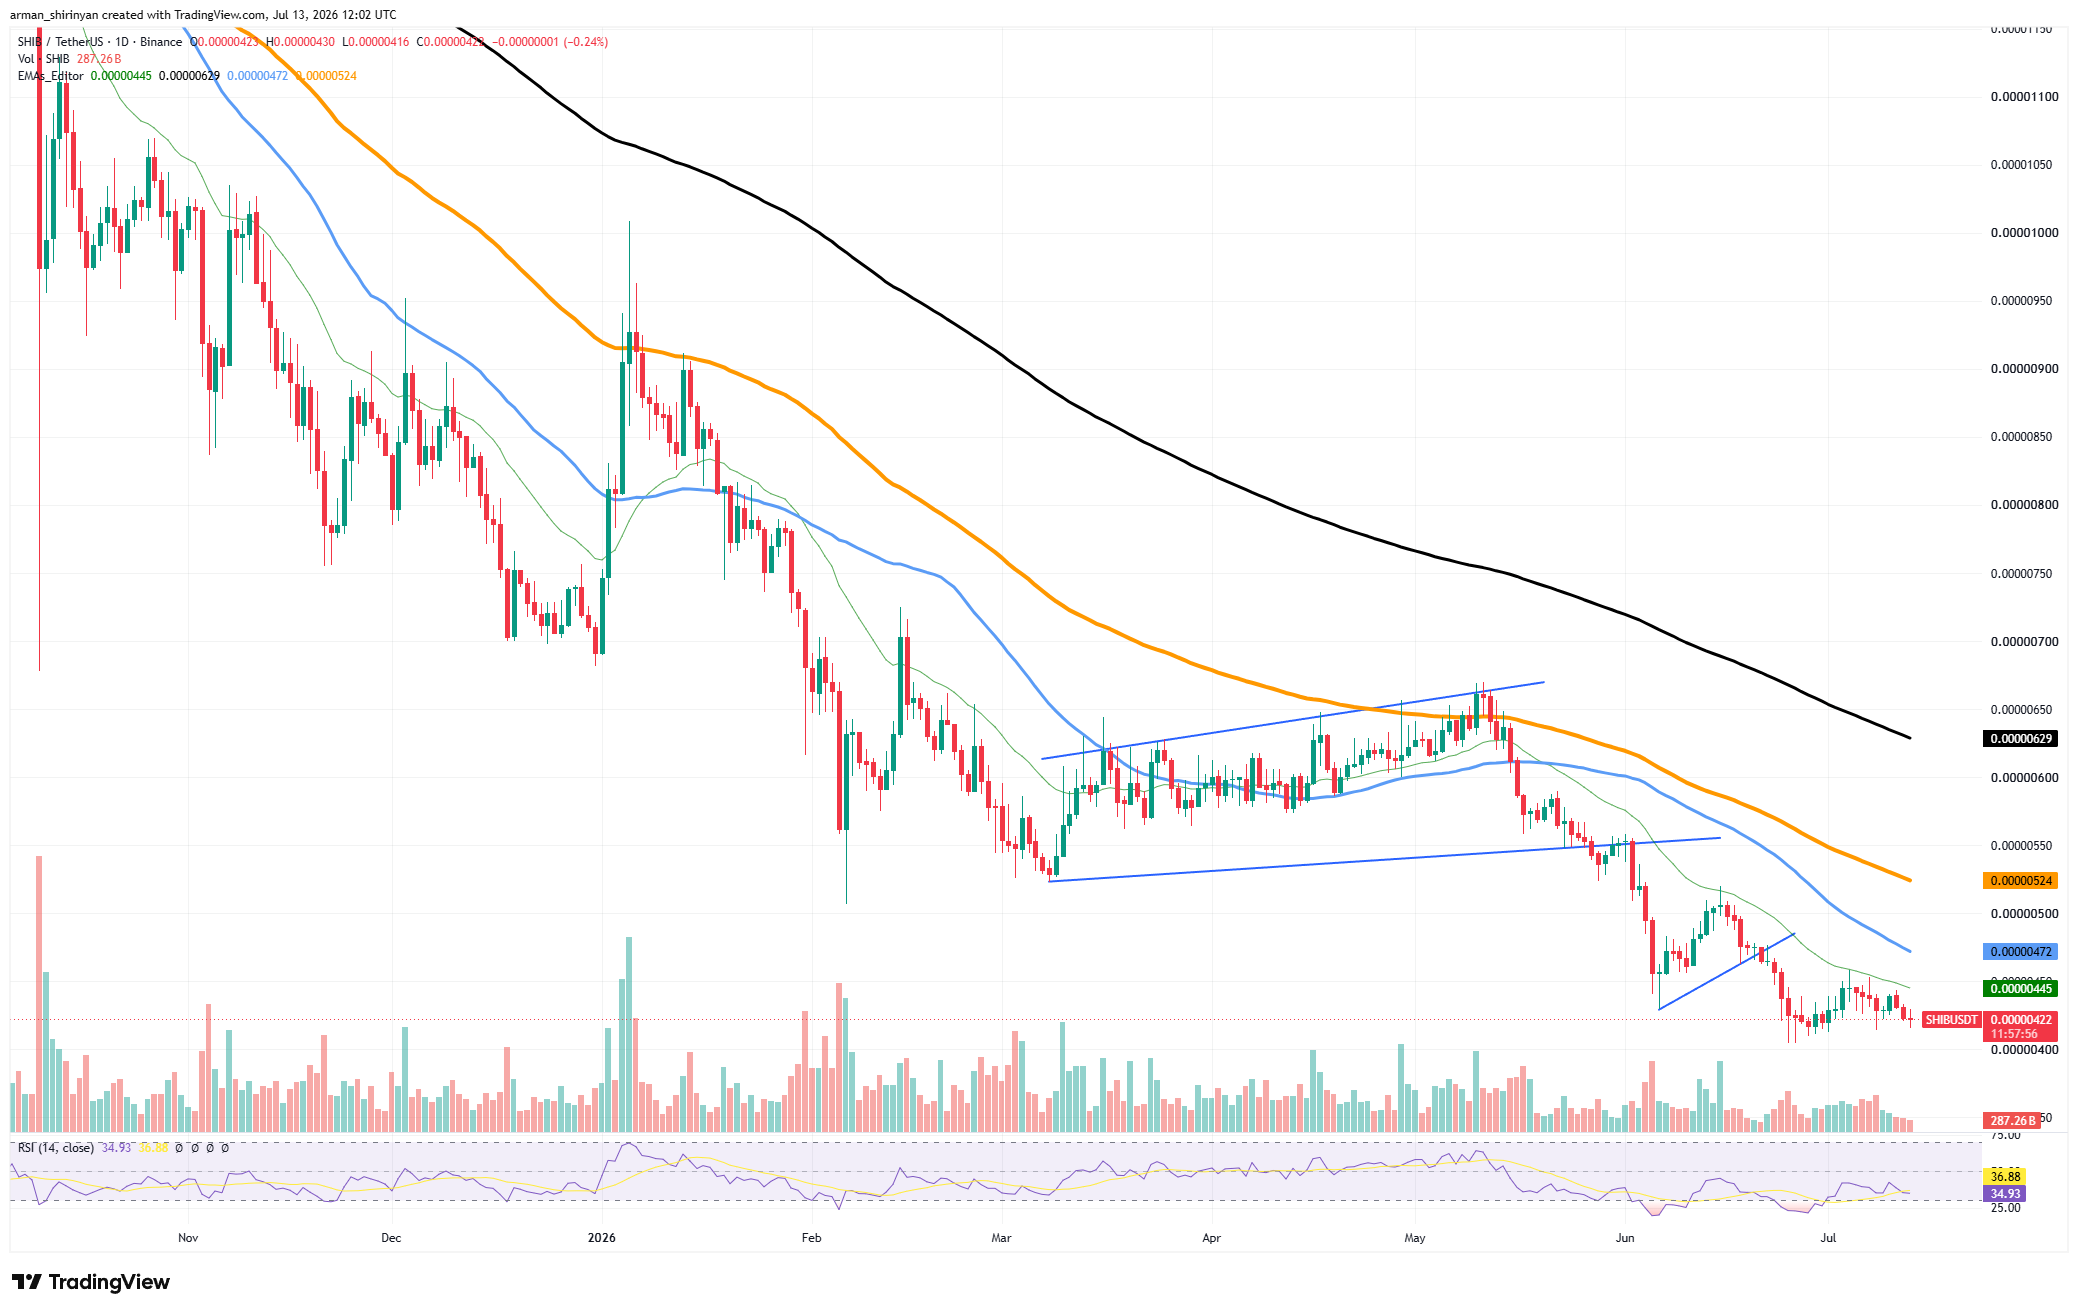
The 50-day, 100-day, and 200-day EMAs are all above the current price action, and the asset is still below each major moving average on the daily chart. $SHIB's situation is still challenging from a technical standpoint. The token formed a rising wedge pattern earlier this year, but it eventually broke downward.
Since then, no significant reversal has been established, and every attempt at recovery has resulted in lower highs. The current bearish trend was reinforced when sellers absorbed recent bounce attempts in June and July. Another layer is added to the picture by the exchange flow data.
Available supply is here
Large token movements on exchanges frequently signal a rise in holders' desire to sell their holdings. Exchange inflows increase available supply on trading platforms and tend to put pressure on prices when market demand is weak, even though they do not ensure instantaneous selling.
The absence of strong accumulation signals elsewhere makes the situation more difficult for $SHIB bulls. Compared to significant rallies observed earlier in the cycle, trading volume is still comparatively low, and momentum indicators are still in bearish territory. Due to a lack of buying conviction, the RSI is still below the neutral 50 level. Nevertheless, not all trading activity is inherently negative.
Some investors transfer funds for portfolio rebalancing, arbitrage opportunities, or liquidity. Furthermore, the market is not yet seeing a panic-driven rush to sell, as evidenced by the comparatively stable total exchange reserves. However, a consistently weak chart and daily exchange inflows of almost 100 billion $SHIB indicate that sellers are still in control for the time being.

 u.today