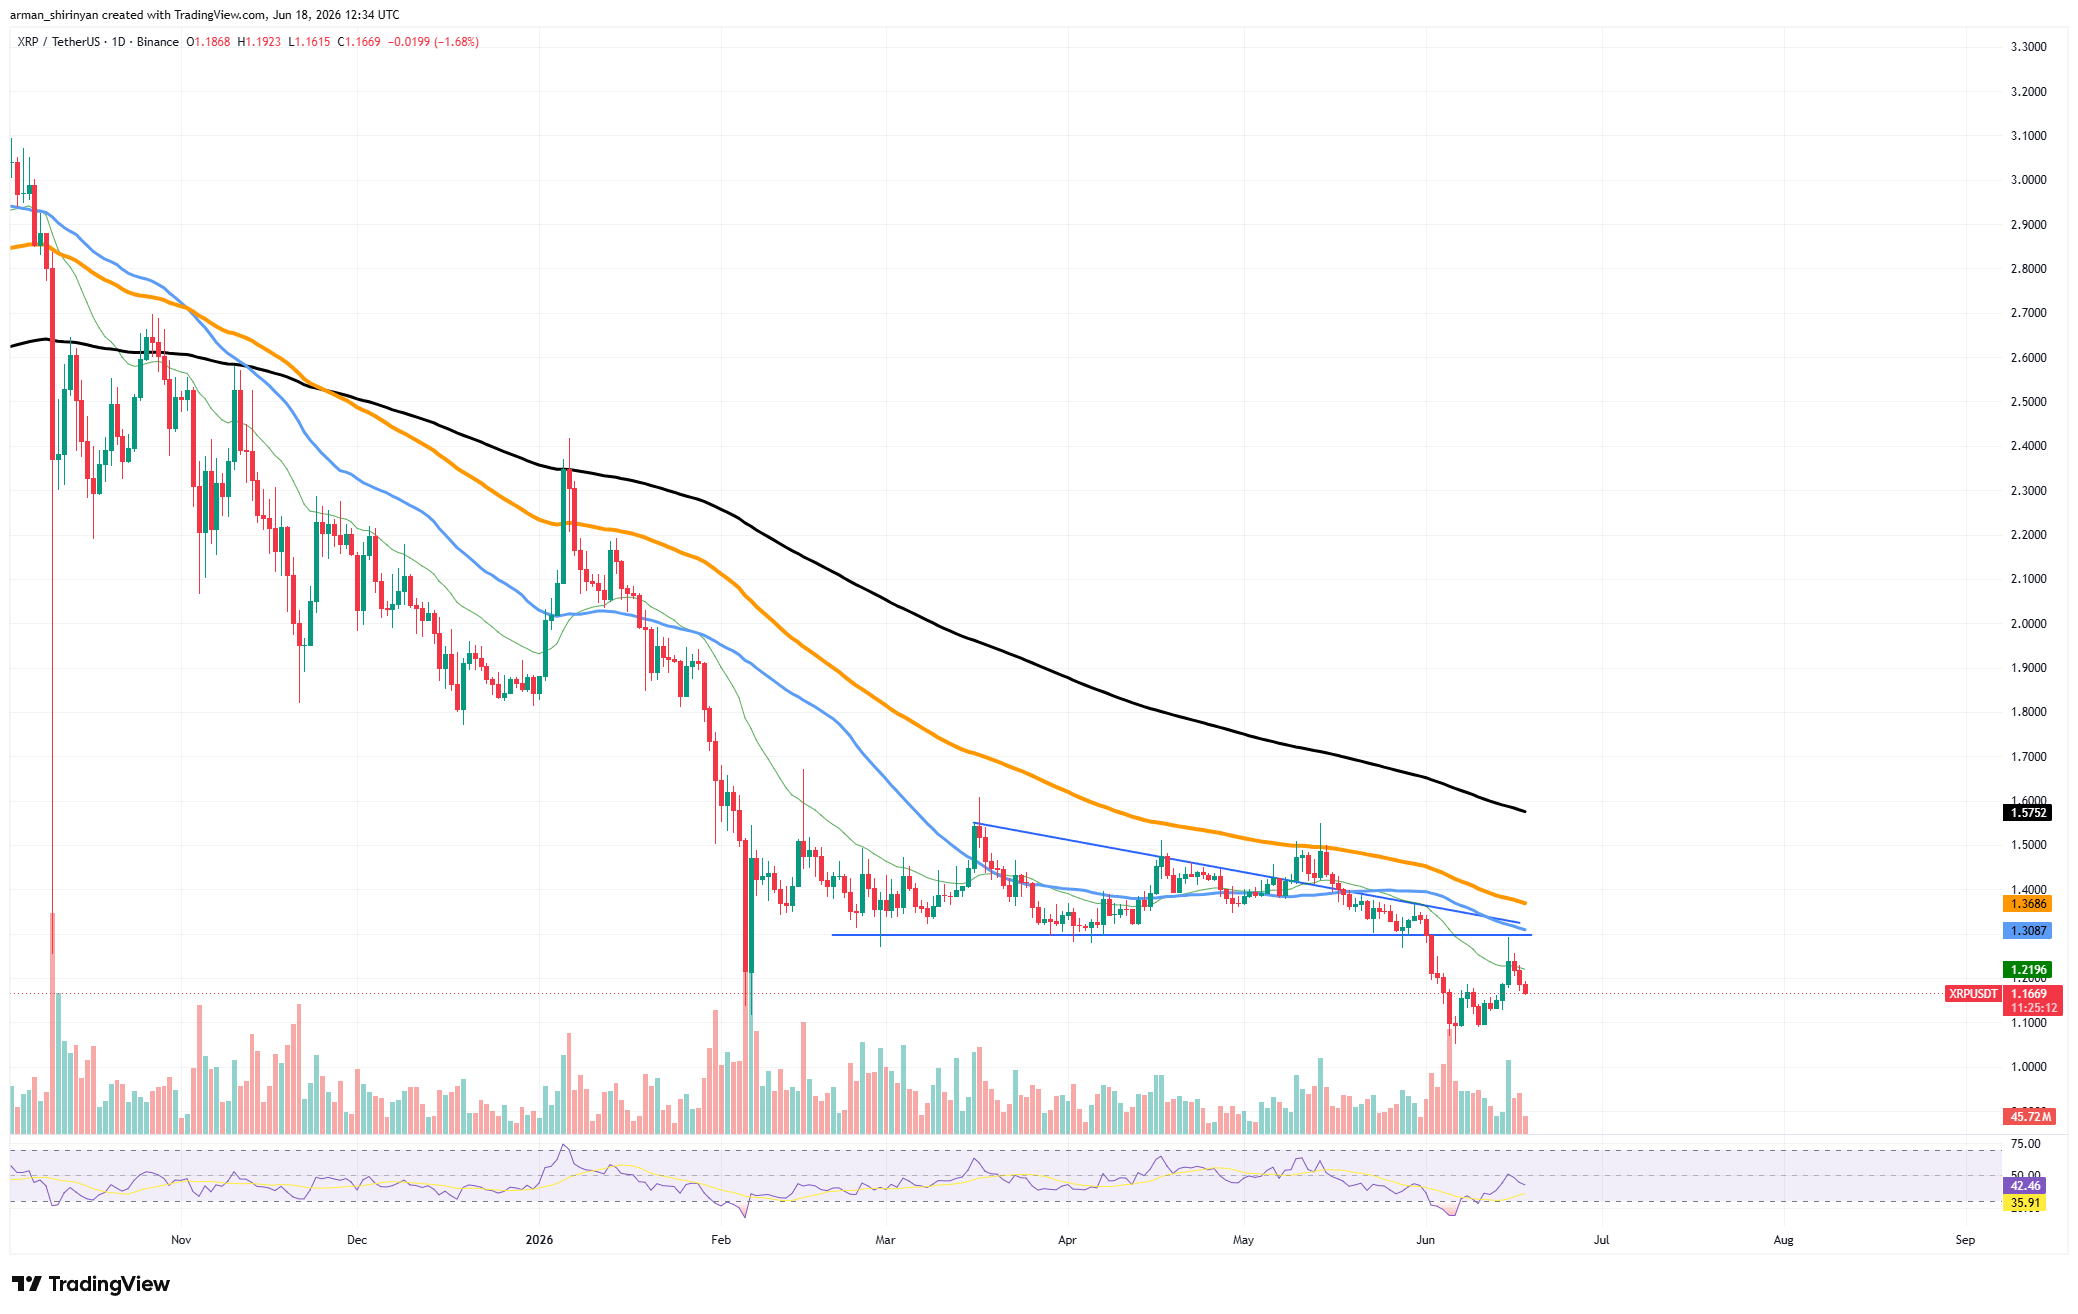
In light of $XRP's recent market structure, the timing is especially intriguing. Earlier this month, $XRP broke below a multi-month consolidation pattern on the chart, briefly declining toward the $1.10 area before staging a recovery. The 50-day and 100-day moving averages near $1.30 formed a significant resistance zone, and although bulls were able to push the asset back above $1.15, the rebound nearly immediately stalled.
Usage isn't crawling up
The lack of conviction in the recovery can be explained by the declining transaction activity. During the selloff, volume rose, but network participation did not follow the rebound with the same vigor. To put it another way, the price increased, but there was no corresponding confirmation signal from fundamental usage.
A number of scenarios are still possible for $XRP. The asset may attempt another move toward the $1.30-$1.35 resistance area if transaction counts rise above the 2 million mark. The technical picture would be considerably improved by a successful breakout there.
As traders wait for more powerful catalysts, the neutral scenario entails ongoing consolidation between approximately $1.10 and $1.30.
If the price loses support at $1.15 and network activity continues to decline, the bearish scenario becomes apparent. If that is the case, $XRP may return to the recent lows between $1.05 and $1.10.
As of right now, the decline below 2 million daily transactions does not necessarily portend catastrophe, but it does demonstrate that $XRP still lacks the robust network expansion required to completely support a more significant bullish reversal.

 u.today