$XRP has slipped into uncharted territory, as its monthly RSI hits the most oversold level in history, triggering speculation of a bullish reversal.
The broader crypto market is currently witnessing renewed selling pressure, and $XRP has not escaped the bloodbath. However, this downtrend has triggered a drop in $XRP’s monthly RSI to uncharted territory, as the indicator reaches its most oversold level in history.
Key Points
- $XRP has crashed 15.37% this month on the back of the most recent market-wide slump.
- This decline has dragged the monthly RSI to an extreme low of 41.7, representing its lowest reading in history.
- The recent figure beats the previous all-time low of 43.75 recorded in March 2020 when $XRP crashed to $0.24.
- Such a historically low RSI reading confirms an extreme oversold level for $XRP and could lead to a bullish reversal.
- $XRP still needs to maintain this reading by the end of the month to confirm the signal.
$XRP Slides Alongside the Crypto Market
Austin, an $XRP community figure and well-regarded market commentator, was the first to call the public’s attention to this RSI crash. His commentary came as $XRP slid alongside the broader crypto market in what seems to be renewed bearish pressure.
For context, Bitcoin ($BTC) recently dumped toward the $63,000 mark after Michael Saylor’s Strategy confirmed selling 32 $BTC out of its over 800K $BTC stash. This downturn has reverberated across the entire crypto market, with the total crypto market cap losing $336 billion this week alone.
$XRP contributes $13.1 billion, as its market cap has dropped by nearly 16% from $82.5 billion at the start of the week to $69 billion at press time. Notably, $XRP’s price has since collapsed from $1.33 to $1.11, revisiting the early-February lows.
$XRP Monthly RSI Hits All-Time Low
Austin’s analysis points out that this downtrend has triggered a massive crash in $XRP’s monthly RSI.
Specifically, data from his chart shows that the RSI, which measures the pace and size of recent price changes, recently dropped to a new all-time low of 42.64, beating the previous record of 43.75. This occurred as $XRP’s price dropped to $1.18 amid the market-wide crash.
However, recent data shows that prices have dropped deeper, and the monthly RSI has slid to new lows. At press time, the $XRP RSI has declined to 41.64, lower than the 42.64 reading pinpointed by Austin. The latest reading comes amid a steeper $XRP price drop to $1.11.
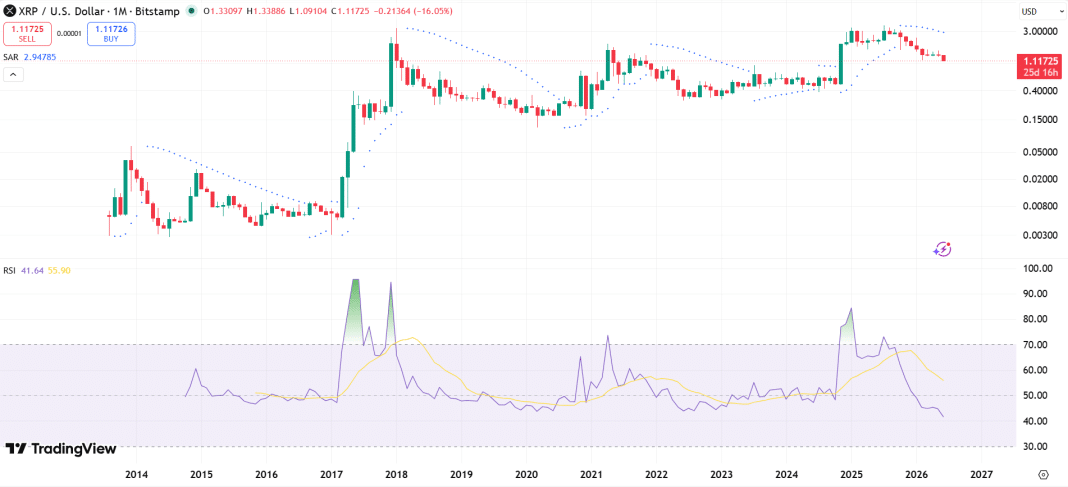
Before now, the lowest the monthly $XRP RSI has gone was 43.75 in March 2020 during the bear market of that time. Expectedly, this aligned with $XRP’s bottom for that bear market, as prices collapsed to $0.11. From here, $XRP only saw higher lows until it recovered to a high of $1.96 by April 2021.
Is a Reversal Inevitable?
If history is anything to go by, $XRP may be preparing for a reversal, especially after seeing consistent declines since October 2025. Within this period, the crypto asset has crashed nearly 61% from $2.84 to the current price of $1.11, and investors have continued to look out for a reversal signal.
Notably, $XRP saw milder declines in late 2024, with the RSI dropping to 48.27 by October, a much higher reading than today. Shortly after this, $XRP staged a rebound effort in November 2024, leading to the 580% increase to $3.4 by January 2025.
Now, the RSI has hit lower values, leading to speculation of another potential reversal. However, it is important to note that this does not represent $XRP’s final RSI reading for the month of June. If the price recovers slightly back above $1.3, the final reading could be well above 41.65, invalidating the analysis.