
 crypto.news
Render rose to $2.25 on May 26, gaining 13.16% over 24 hours and 24.16% over seven days, according to crypto.news price data.
The token traded between $1.99 and $2.26 during the same 24-hour period, while trading volume stood at $219.35 million.
The move came as Santiment reported a sharp rise in Render’s on-chain activity. The analytics platform said daily active addresses climbed to 394 in one day, while 118 new wallets were created. Both figures reached their highest levels in 12 weeks.
Santiment said “Render’s on-chain activity has seen a major breakout in late May.” The firm added that the token moved back above $2.25 for the first time in more than four months.
The increase in active addresses shows that more wallets used the network during the move. The rise in new wallets also points to fresh users entering the Render ecosystem during the latest price rebound.
AI demand keeps Render in focus
Render has remained closely tied to the artificial intelligence trade because its network supports decentralized GPU computing. The project connects users who need computing power with distributed GPU providers that can process rendering, machine learning, and AI-related workloads.
Santiment linked much of Render’s 2026 momentum to demand for AI infrastructure. It said Render has positioned itself as a decentralized GPU computing network that can support AI training, machine learning, and advanced rendering tasks.
📈 Render’s on-chain activity has seen a major breakout in late May, jumping back above $2.25 for the first time in over 4 months. Daily active addresses climbed to 394 in a single day with 118 new wallets created, both hitting their highest marks in 12 weeks. These two metrics… pic.twitter.com/gFJAl2ipJj
— Santiment Intelligence (@SantimentData) May 26, 2026
That theme also fits broader crypto.news coverage of AI-linked tokens. A previous crypto.news report described Render as a token linked to GPU scarcity and decentralized rendering demand, noting that the market often connects RNDR with AI compute and distributed GPU use cases.
The same report also noted that Render can benefit when investors focus on persistent GPU bottlenecks and distributed rendering power. However, it also listed competition from cloud providers and other DePIN GPU networks as a risk for the sector.
Bollinger Bands show a stretched breakout
Technical data showed Render trading above the upper Bollinger Band at $2.176. The middle band stood near $1.944, while the lower band was around $1.712.
A move above the upper band often shows strong short-term buying pressure. It can also mean the move is stretched if buyers fail to hold the breakout zone. For Render, the $2.17 to $2.18 area now serves as the first key level to watch.
If Render stays above that range, the breakout structure remains active. A clean push above $2.27 would give buyers stronger confirmation because it would clear the recent high area.
If price falls back below $2.17, the setup would weaken. In that case, the middle Bollinger Band near $1.94 would become the next major support zone on the daily chart.
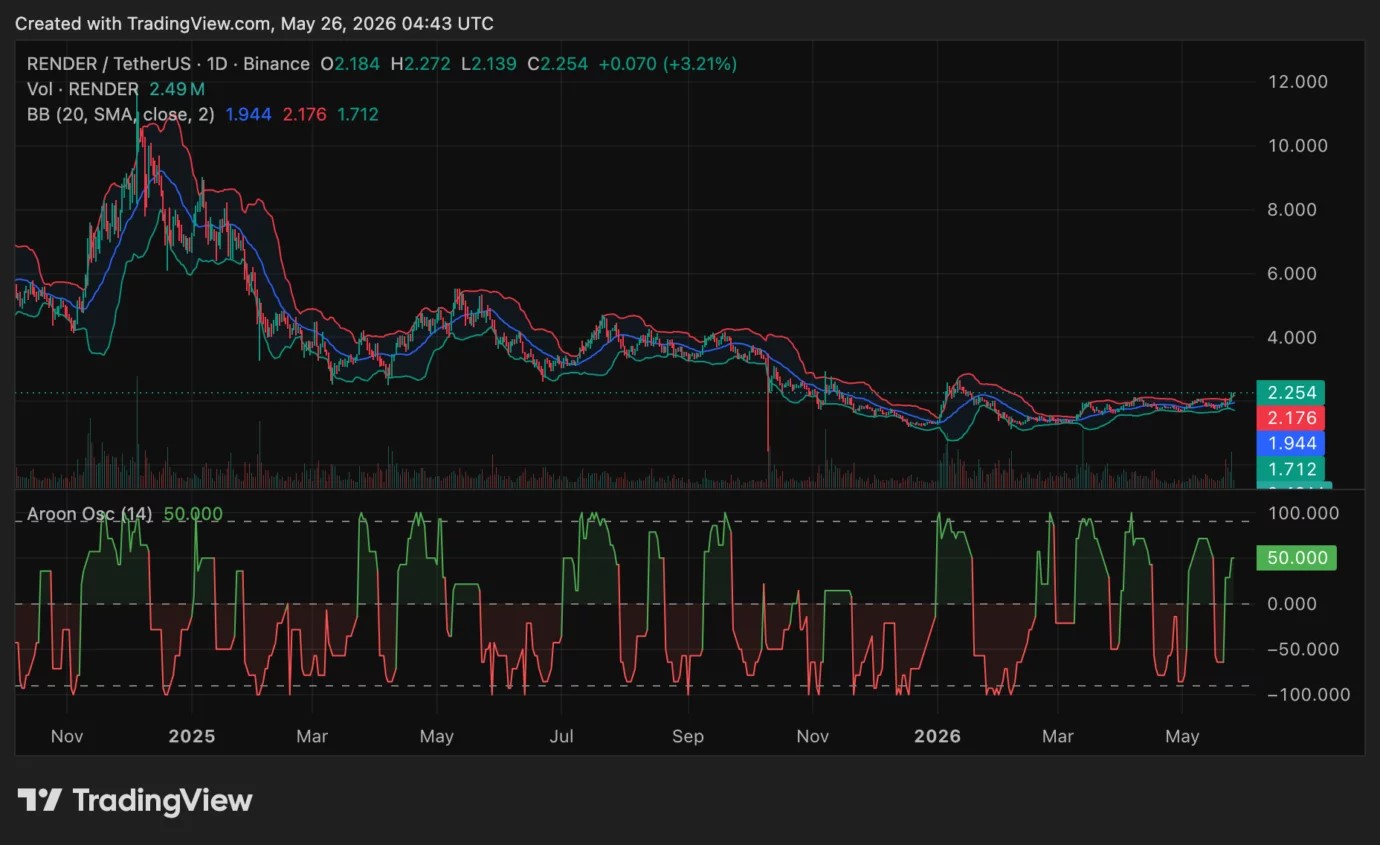
Volume also increased during the upward move. The chart showed volume near 2.49 million, which supported the breakout attempt. Still, volume did not reach the kind of extreme level seen during larger past moves.
The Aroon Oscillator stood at 50, showing positive momentum but not full trend strength. The recovery from negative territory showed that buyers had regained short-term control.
Derivatives data shows stronger trader interest
Derivatives data added another layer to Render’s move. According to Coinglass data, trading volume rose 126.52% to $302.39 million, while open interest increased 47.27% to $112.82 million.
Rising open interest means more futures positions were active during the move. When open interest climbs with price, it often shows that traders are adding exposure instead of only closing old positions.
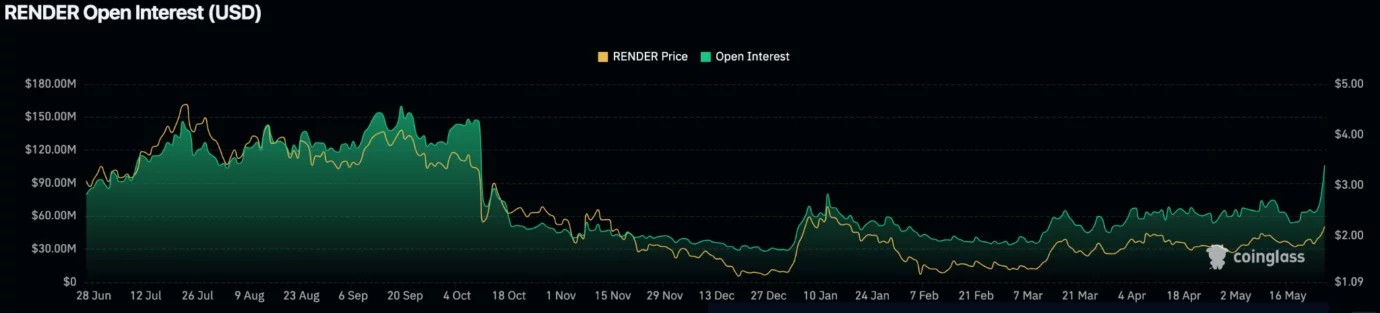
This does not confirm that all new positions are bullish. It only shows that more capital has entered Render-linked derivatives markets. That makes the next price move more important because crowded positioning can raise volatility.
Render’s market capitalization stood at $1.16 billion, with a fully diluted valuation of $1.20 billion. The token ranked #63 by market cap, while its circulating supply stood at 518.74 million tokens.
Despite the latest rally, Render remained far below its all-time high of $13.53, set on Mar. 17, 2024. crypto.news data also showed that Render was still down 53.61% over the past year, even after gaining 24.71% over the past 30 days.
The current setup leaves Render at a clear short-term test. On-chain activity has improved, AI demand remains part of the market story, and derivatives activity has expanded. Price now needs to hold above the breakout zone to keep the rebound intact.