
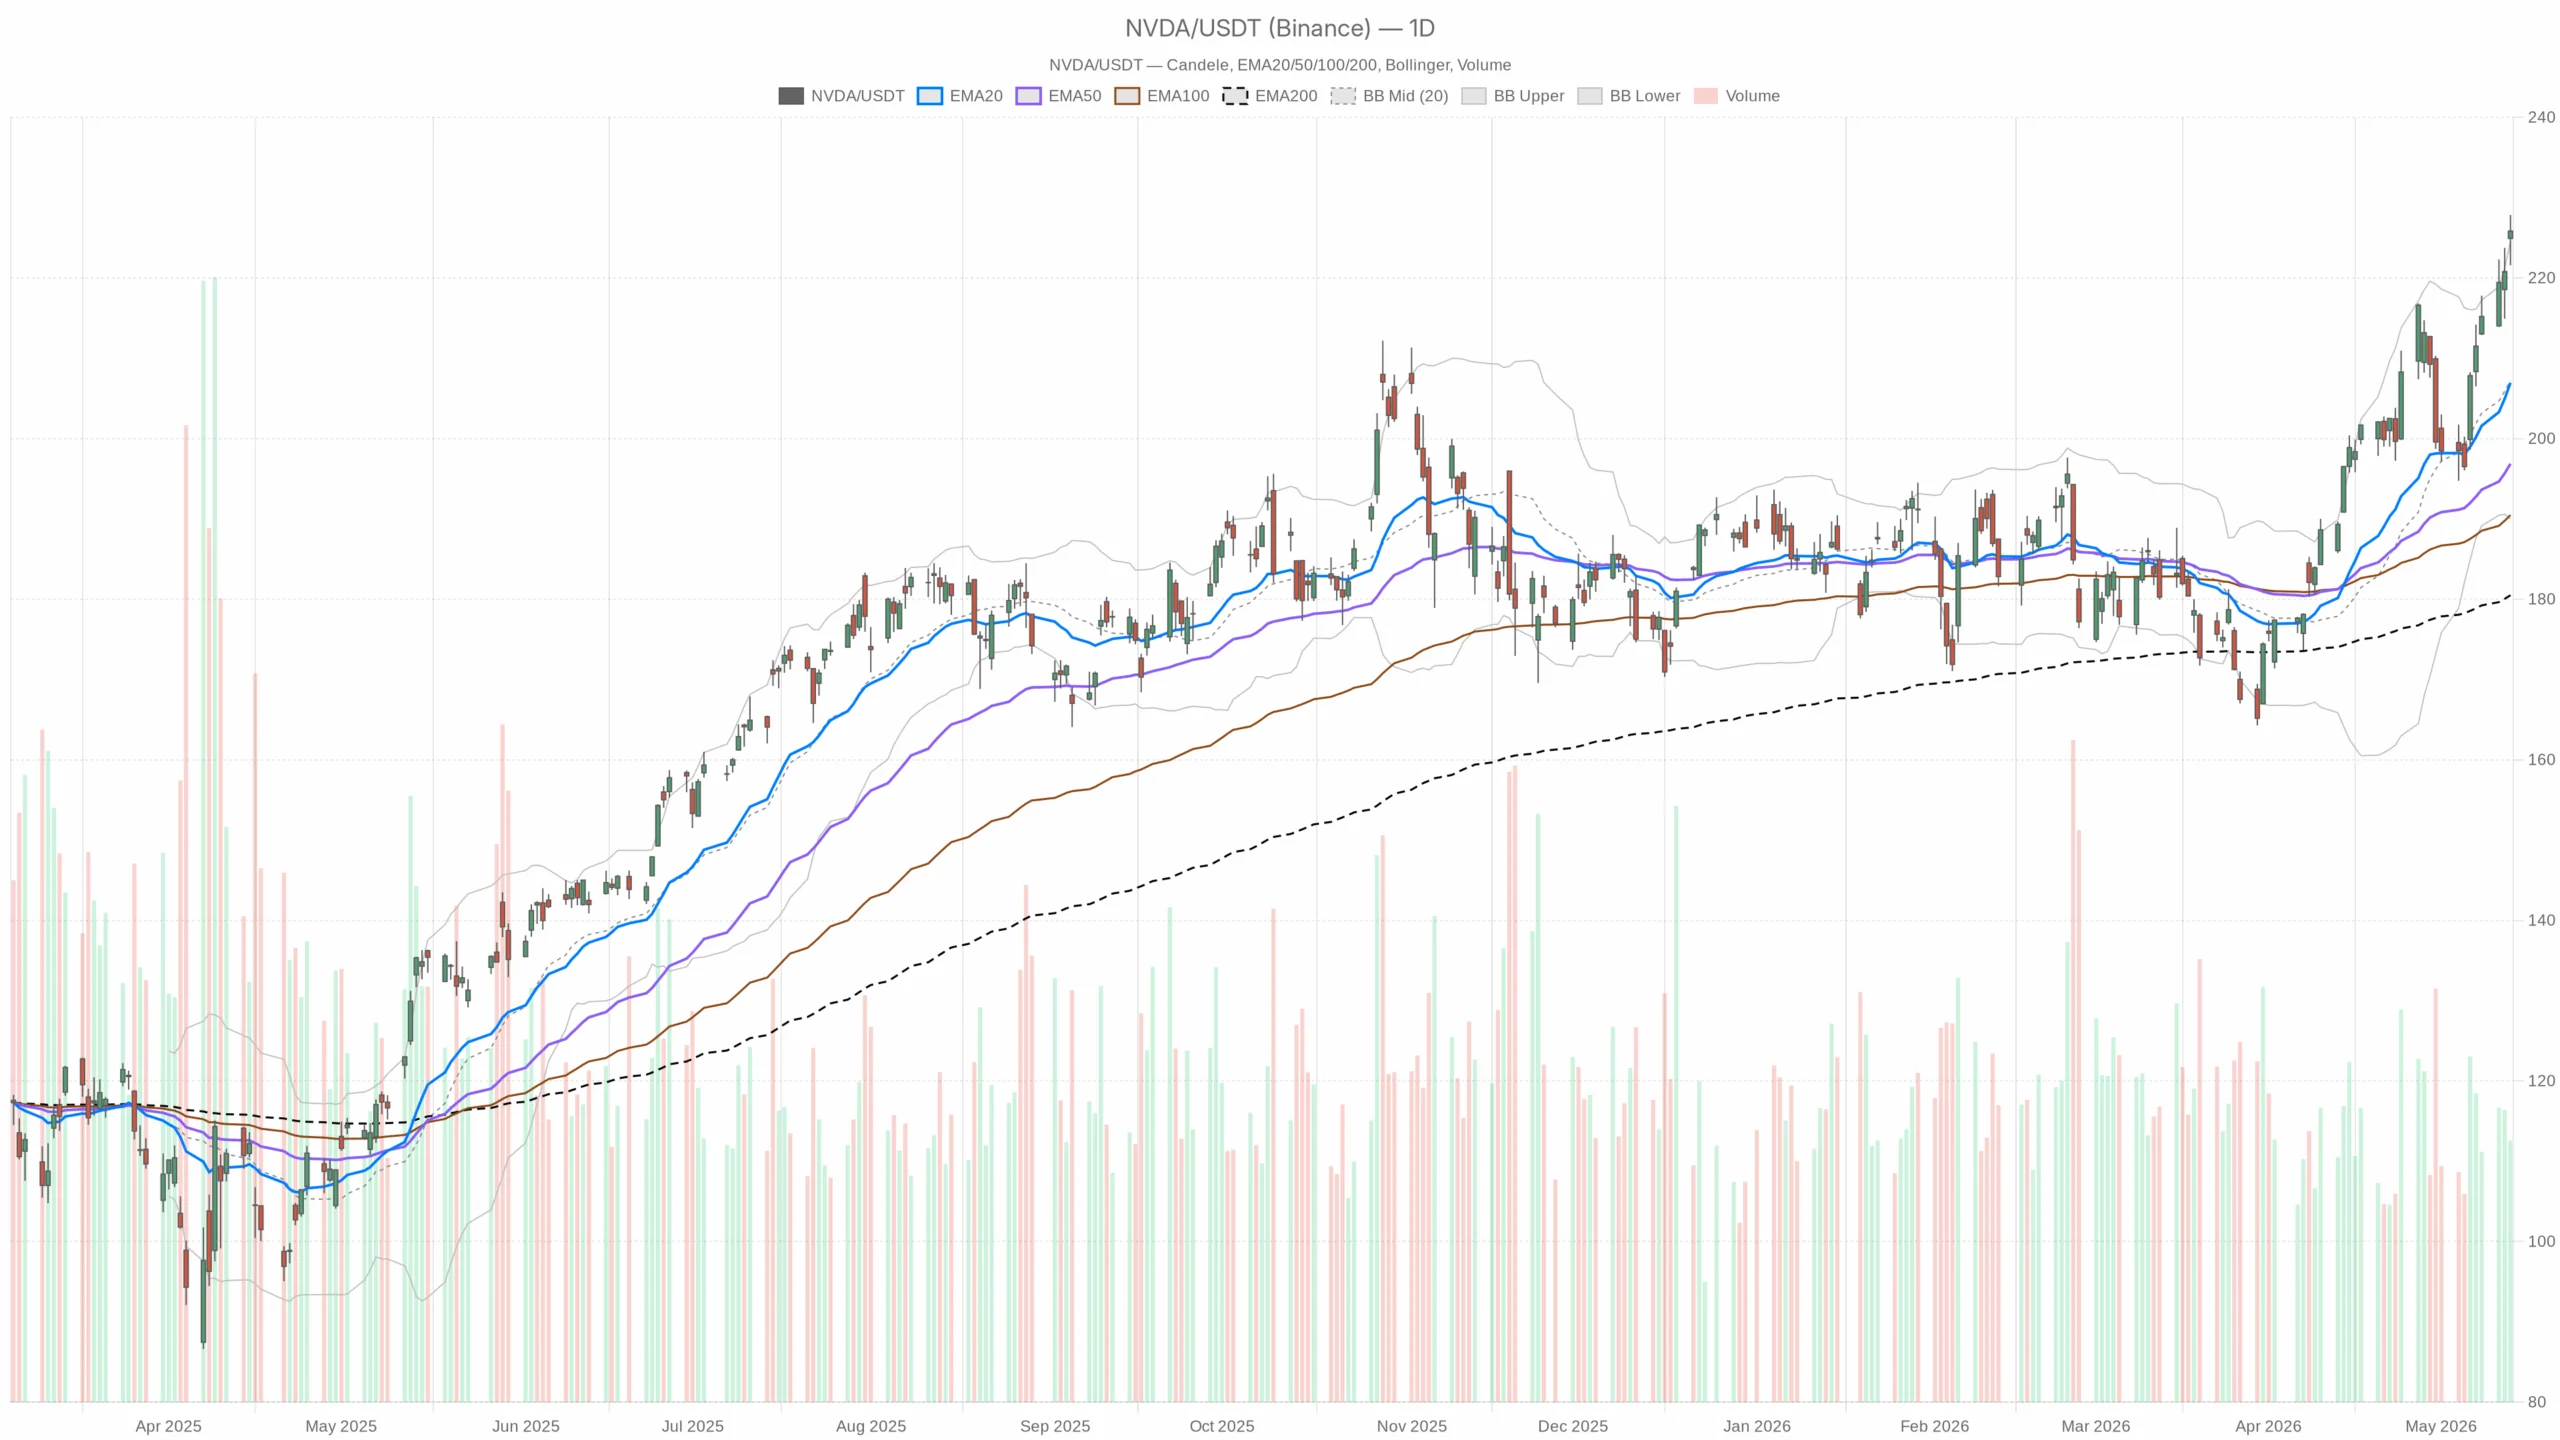
Nvidia Stock has reasserted its uptrend, with NVDA trading above all key moving averages and even the upper Bollinger Band. Bulls control the daily trend into next week’s earnings, yet momentum looks stretched, increasing near-term shakeout risk around key intraday pivots.
Nvidia Stock daily trend: bullish but stretched
Trend alignment and momentum
On the daily chart, EMAs are firmly stacked higher, with price well above them: EMA20 206.95, EMA50 196.86, EMA200 180.49. This signals strong trend alignment and room for pullbacks without structural damage.
Daily RSI14 72.13 shows hot, overbought momentum, which elevates near-term shakeout risk even within an advance. Meanwhile, the daily MACD 7.93 sits over its signal at 6.47 with a positive histogram of 1.46, confirming upside momentum.
Volatility and pivots
Bollinger Bands center at 207.25 with an upper band at 224.49 and a lower band at 190.00. Price closed at 225.83, above the upper band. Therefore, the move looks extended and prone to mean reversion or sideways cooling.
Daily ATR14 8.11 signals elevated volatility, so ranges can widen and amplify both breakouts and reversals. Notably, daily pivots place the pivot at 225.08, R1 228.59, and S1 222.32—framing 225 as the immediate battleground.
NVDA 1H outlook: positive trend, cooling momentum
Structure and indicators
On the 1H timeframe, the uptrend backs the daily view. EMA20 221.95, EMA50 215.92, and EMA200 202.53 sit below price, creating layered support.
RSI14 68.45 is firm and near overbought, so follow-through may slow without consolidation. In addition, the 1H MACD 3.59 is only marginally over its signal at 3.39, with a small histogram of 0.20, hinting at momentum fade at the margin.
Bands and intraday pivots
1H Bollinger Bands center on 221.97 with the upper band at 229.16 and the lower at 214.79. Thus, NVDA has room to probe 229 before resistance, while downside air remains toward 215 if sellers press.
1H ATR14 2.85 highlights active swings. Meanwhile, the 1H pivot at 225.92 with R1 226.76 and S1 225.03 makes 225–226 a control zone where short-term direction is often decided.
15-minute NVDA setup: consolidation around pivots
On the 15-minute chart, conditions look neutral. EMA20 225.97 now sits just above price, while EMA50 223.61 and EMA200 215.62 trail below. Therefore, immediate momentum has paused, but the broader intraday backdrop remains constructive.
RSI14 53.24 is neutral. However, the 15m MACD 0.94 is below its signal at 1.29 with a negative histogram of -0.35, favoring mild dips or sideways churn.
Bollinger Bands center at 226.72 with an upper at 227.71 and a lower at 225.72. Price sits beneath the mid-band, consistent with consolidation. The 15m ATR14 0.80 implies tight micro swings.
Intraday pivots show 225.75 with R1 226.41 and S1 225.20. Consequently, scalpers will watch 225.2–226.4 for immediate reaction.
Earnings and sentiment ahead of Nvidia Stock results
Meanwhile, the news flow frames next week’s catalyst. Nvidia reports fiscal Q1 on May 20, keeping event risk high. Therefore, positioning may stay tactical into the print.
A Yahoo Finance piece highlights strong Nebius results and notes added confidence among Nvidia bulls, reinforcing AI-infrastructure demand into earnings. In contrast, The Motley Fool flags competition and valuation concerns. As a result, sentiment looks constructive rather than euphoric, which can temper extremes.
NVDA trading scenarios into earnings
Base case (bullish): the daily uptrend holds while overbought conditions cool through time rather than price. A steady defense of 225.1 (daily pivot) and 222.3 (daily S1) is key. Combined with a 1H close above 226.8 (1H R1), it favors a push toward 228.6 (daily R1).
A clean break over 228.6 could invite a test of 229.2 (1H upper band) and potentially the low-230s within the daily ATR envelope. Therefore, momentum extension remains possible while volatility stays elevated.
Bear case: failure to hold the 225–222 zone shifts control to sellers. A sustained break below 222.3 would expose 215 on the 1H lower Bollinger Band, opening a deeper retracement window.
If momentum fully unwinds, a mean reversion toward the daily mid-band around 207.3 and the EMA20 206.95 becomes plausible. That would reset the trend without breaking the longer-term structure, though it would challenge late longs.
Overall, Nvidia Stock’s daily trend is bullish but stretched above the bands with an overbought RSI. At the same time, the 1H corroborates the advance while hinting at cooling momentum, and the 15m shows a pause around tight pivots. Therefore, expect higher volatility and headline sensitivity into earnings near the 222–226 control area, with 228–229 capping until momentum re-accelerates.