
Recent capital inflows into Cosmos appear largely speculative, as the underlying liquidity conditions do not fully support the current bullish momentum.
The asset attracted significant attention over the past 24 hours after rallying 9.5%.
However, at press time, market data suggested that sellers still maintained active control across several segments of the market. This raises the possibility that the current rally could be a bull trap, as AMBCrypto’s analysis highlights weakening liquidity conditions despite the price surge.
Short positions dominate $250M volume surge
Although Cosmos [$ATOM] price action remains bullish on the surface, the broader derivatives structure suggests there is a strong possibility that the ongoing rally could trap late buyers.
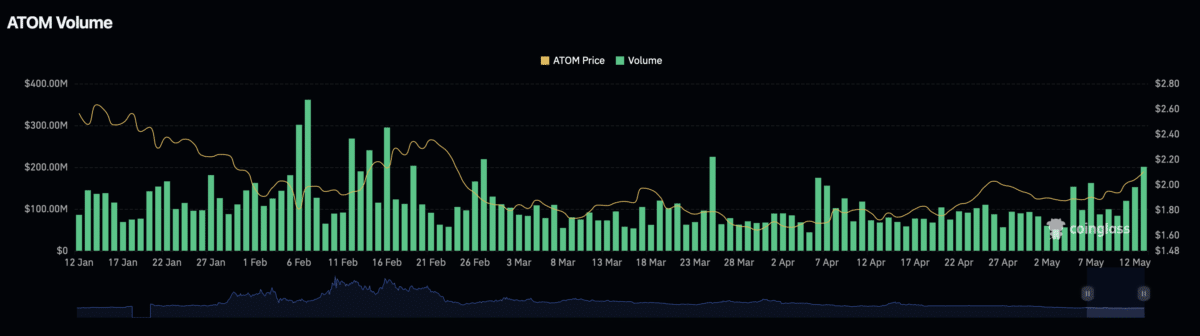
Press time data showed a significant increase in perpetual market volume, which climbed to slightly above $250 million.
Such a rise in volume often reflects growing activity between buyers and sellers. However, the long-to-short ratio provided additional context, showing that short positions dominated most of the trades executed during this period.
At the time of writing, the ratio had dropped to roughly 0.79 on the chart.
Typically, whenever the ratio falls below 1, it indicates that bearish traders control a larger share of trading volume. The deeper the ratio declines below 1, the stronger the seller dominance becomes, which remains the current market condition.
At the same time, funding activity from short sellers has continued to rise, showing that traders betting against $ATOM are increasing their contract exposure. Capital allocation in $ATOM’s perpetual market also continues to favor short positions over longs.
Spot market records fresh $374k outflows
The ongoing sell-off is not limited to the perpetual market alone. At press time, selling pressure had also intensified across the spot market.
Spot flow, a key metric used to track capital inflows and outflows in the spot market, showed clear evidence that sellers currently dominate trading activity.
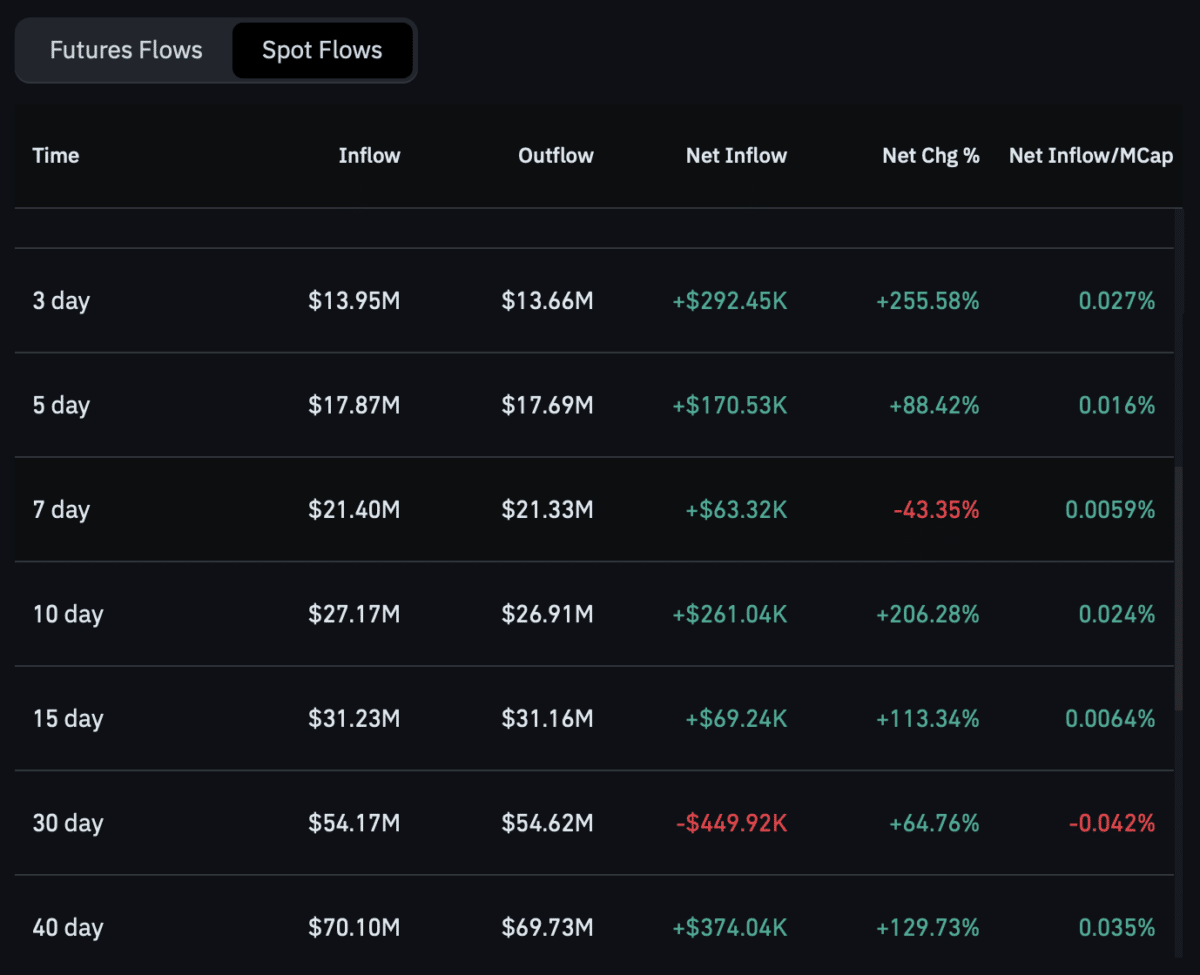
The 24-hour net inflow recorded roughly $107,000 in sell pressure. While the figure remains relatively modest and marks only a slight shift from the previous day’s buying activity, it still suggests a trend worth monitoring closely.
This pattern has also appeared across broader time frames. Over the past 40 days, cumulative sell pressure reached approximately $374,000. Another significant wave of selling emerged within the past 10 days, with nearly $261,000 in additional sell pressure recorded during that period.
Liquidation heatmap points to targets below $2.1
Liquidation Heatmap remains an important metric for predicting possible market direction. These levels often highlight areas with high concentrations of unfilled orders that could attract price movement once triggered.
In total, the market currently holds roughly $371,000 in liquidated amount.
At press time, the Liquidation Heatmap suggested there is a higher probability that the price could trend lower, as more liquidity clusters are positioned below the current price compared to the upside.
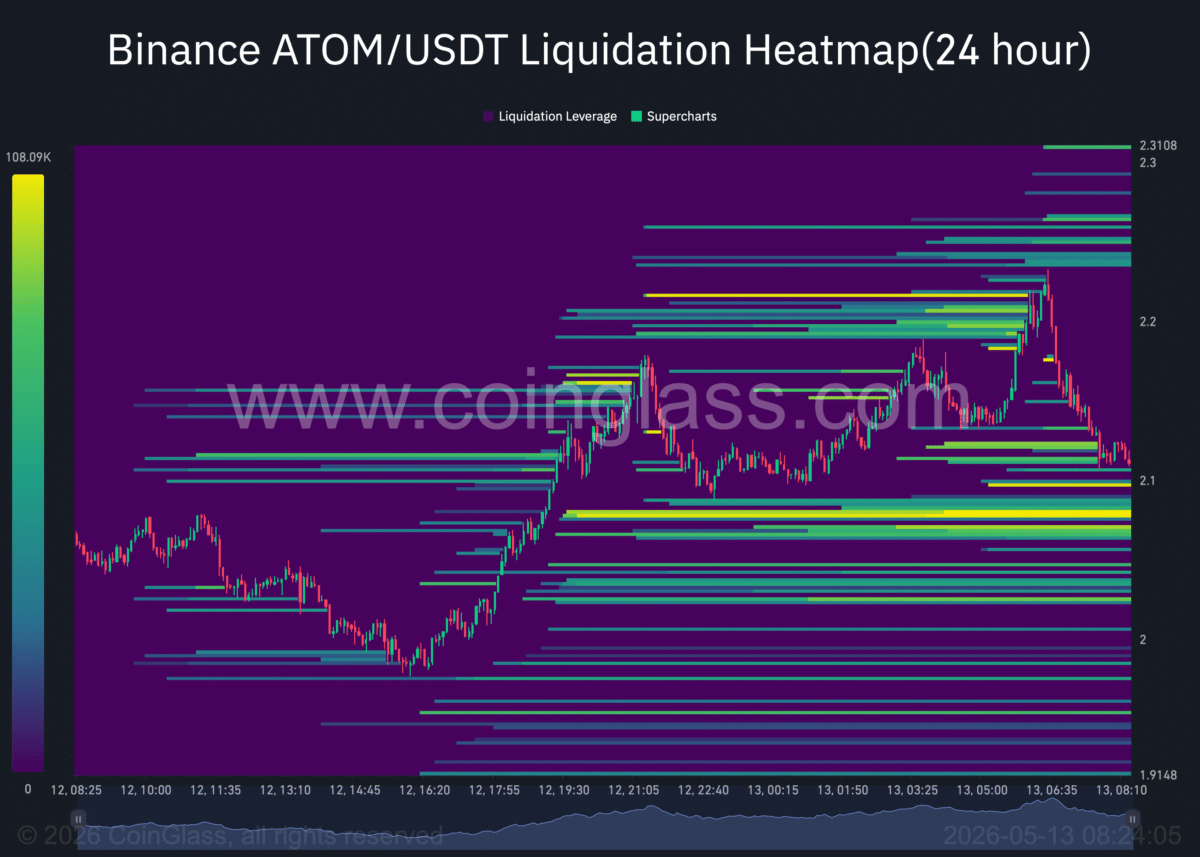
The closest major liquidity level remains around the $2.1 region. With several additional clusters sitting beneath that zone, $ATOM could potentially sweep these lower levels before attempting another upward rebound.
Final Summary
- Sellers maintain control despite $ATOM’s 9.5% rally as derivatives data shows sustained bearish dominance.
- Liquidation clusters and spot outflows suggest the price could be drawn toward lower liquidity zones below $2.1.