
Dogecoin is holding inside a fresh accumulation zone while analysts compare the current structure with earlier mini cycles that led to sharp rallies. A breakout above key trend resistance, supported by improving RSI and MACD signals, could shift attention toward the $0.6533 target.
Dogecoin Holds Third Accumulation Zone as Traders Watch Mini Cycle Repeat
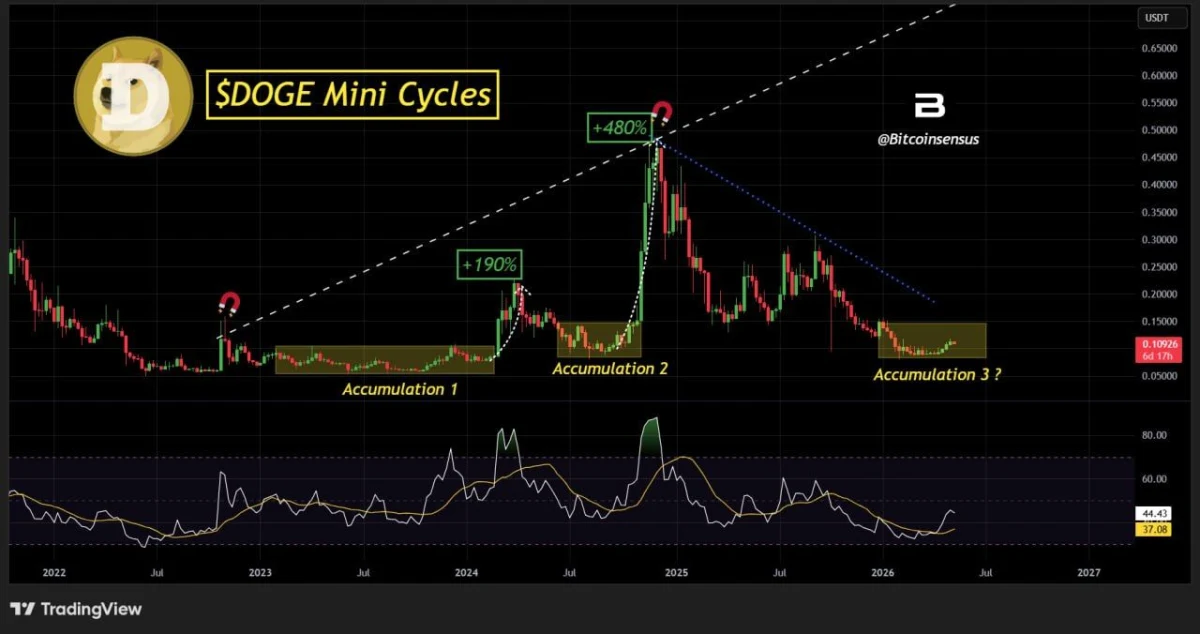
Dogecoin is trading inside a third accumulation zone, according to a chart shared by Bitcoinsensus. The setup compares $DOGE’s current sideways structure with two previous mini cycles that led to sharp upside moves.
Dogecoin Mini Cycle Setup. Source: Bitcoinsensus on X
The chart shows $DOGE moving through repeated phases of sideways accumulation followed by strong rallies. The first marked accumulation phase came before a 190% move, while the second phase came before a 480% rally.
Bitcoinsensus asked whether the current accumulation phase could lead to another upward move. The latest yellow box marks “Accumulation 3?” near the lower part of Dogecoin’s recent range, where price has been moving sideways after a long pullback.
The chart also shows $DOGE trying to recover from a descending trendline that started after the late 2024 high. A break above that blue dotted trendline would strengthen the case for another mini cycle move.
The RSI panel adds another detail. Momentum has started to turn higher from a low area, while the RSI line moved back above its signal line. That shows early improvement, but $DOGE still needs stronger follow-through.
For now, the key question is whether Dogecoin can turn this sideways base into a breakout. If buyers defend the accumulation zone and push above the descending trendline, traders may look for a repeat of the earlier mini cycle structure.
Dogecoin Breakout Points to $0.6533 Target as MACD Divergence Builds
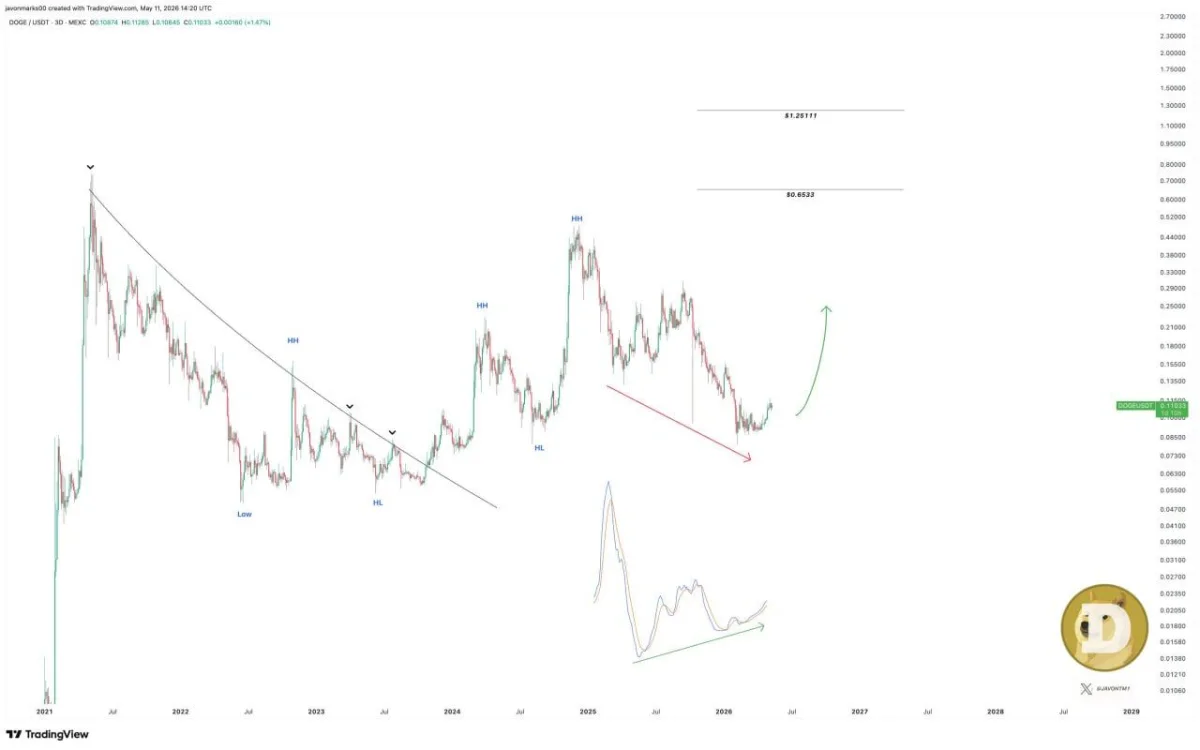
Dogecoin is showing a bullish breakout after reacting to a long-term MACD divergence, according to a chart shared by Javon Marks. The setup points to a possible move toward $0.6533 if buyers keep control.
Dogecoin MACD Divergence Setup. Source: Javon Marks on X
The chart shows $DOGE breaking away from a long descending trendline that started after the 2021 cycle high. Since that breakout, Dogecoin has formed higher highs and higher lows, which shows a stronger market structure than the earlier downtrend.
Javon Marks said $DOGE has begun to respond more positively to a major bullish divergence on the MACD. A bullish divergence appears when price makes weaker lows while momentum starts to improve. Traders often watch this setup because it can appear before a larger trend reversal.
The chart marks a first major upside target near $0.6533. That would represent a large move from the current structure and would bring Dogecoin back toward levels last seen during the 2021 cycle.
Marks also said a break above $0.6533 could open the path toward the $1.25 area. However, $DOGE would first need to confirm strength above nearby resistance zones and keep the breakout structure active.
For now, the main focus is whether Dogecoin can continue building on the MACD divergence. If momentum keeps rising and buyers defend the recent base, traders may watch for a larger recovery phase in $DOGE.