
BUILDon (B) continued its aggressive upward trend after posting another strong daily gain. The token climbed to $0.6244 following a 35.78% surge in the past 24 hours. Weekly gains now stand above 82%, highlighting intense bullish momentum across the market.
Trading activity also accelerated sharply, with daily volume reaching more than $117 million. The latest breakout pushed BUILDon close to the critical $0.68 resistance zone after weeks of sideways accumulation between $0.10 and $0.15.
The 4-hour chart shows a near-vertical recovery structure as buyers maintained control throughout the recent rally. Price now trades far above the EMA 20, 50, 100, and 200 levels.
Consequently, the broader trend still favors upside continuation despite growing volatility risks. Expanding candle ranges further confirm strong momentum participation from short-term traders.
Momentum Indicators Support the Uptrend
Technical indicators continue signaling bullish conditions across multiple timeframes. The Supertrend indicator remains firmly positive near the $0.45 region, which now acts as major trend support. Besides, Fibonacci retracement analysis shows price reclaiming the important 0.786 zone near $0.55 before testing higher resistance levels.
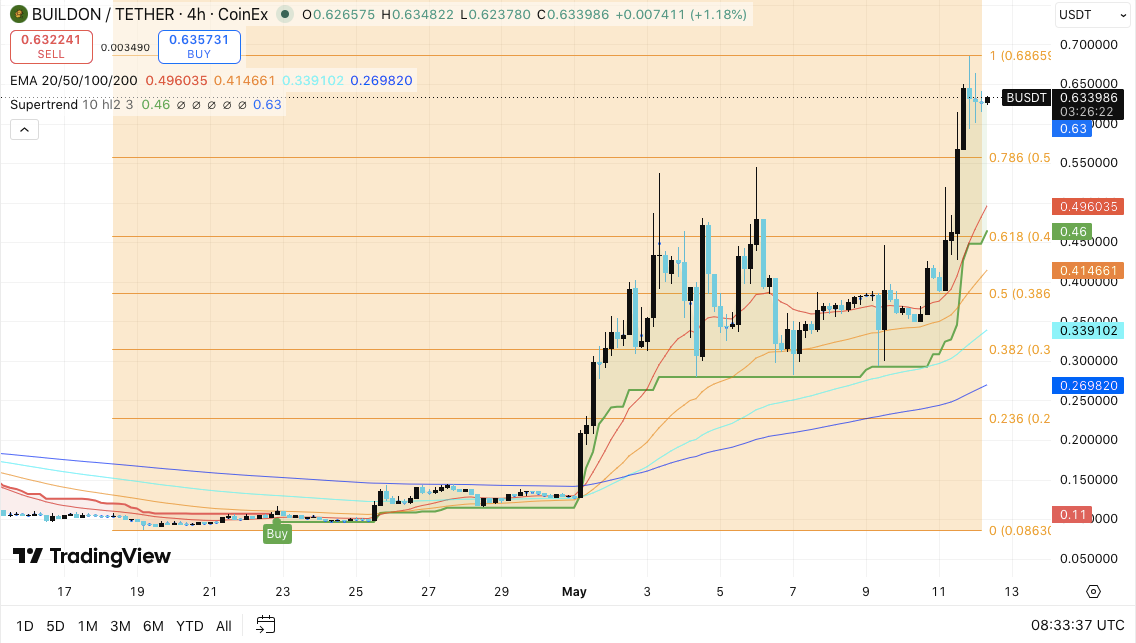
The immediate resistance area stands between $0.65 and $0.68. This zone recently rejected price during the latest rally attempt. However, a successful breakout above $0.70 could trigger another acceleration phase toward the $0.80 level.
On the downside, traders continue watching the $0.55 region as the first important support area. Additionally, the $0.48 to $0.50 zone aligns closely with the EMA 20 cluster, strengthening its importance for short-term trend stability.
Related: Cardano Price Prediction: Grayscale ADA ETF Expected by October as RWA Proposal Hits the Treasury
If bearish pressure increases, the $0.40 to $0.45 region could provide stronger structural support near the Supertrend indicator. Meanwhile, the $0.33 level remains the deeper support area connected to the EMA 100.
Open Interest and Exchange Flows Signal Rising Speculation
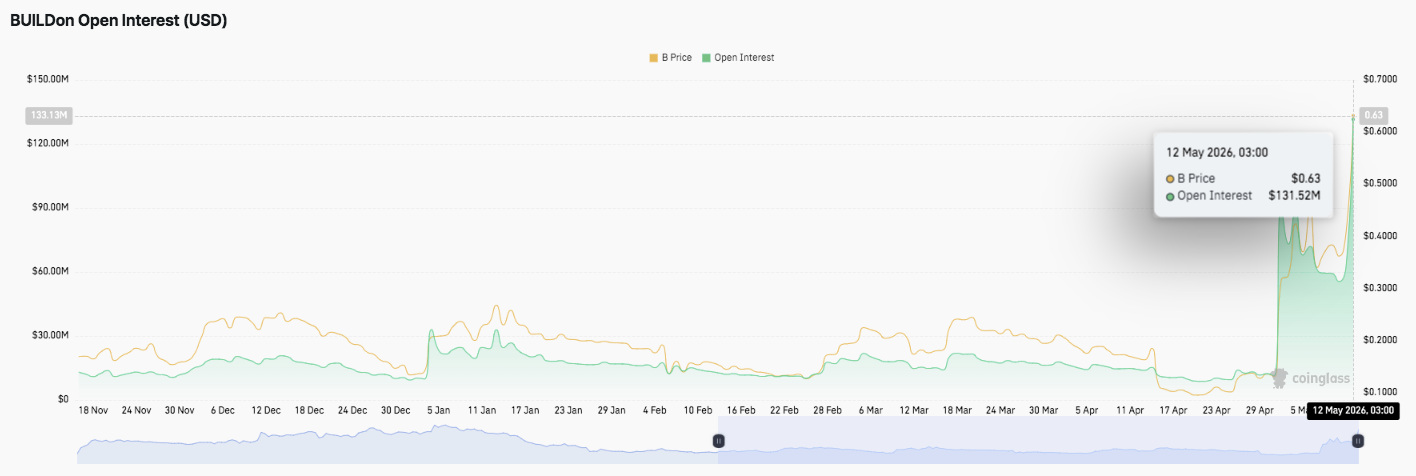
Derivatives activity increased significantly during the latest rally phase. Open interest remained relatively stable between November and April, fluctuating mostly between $10 million and $30 million. However, market conditions changed dramatically in early May.
Open interest suddenly surged above $100 million and recently reached nearly $131.5 million. Significantly, this increase arrived alongside the rapid price expansion toward $0.63. The trend reflects growing speculative positioning and stronger trader participation across leveraged markets.
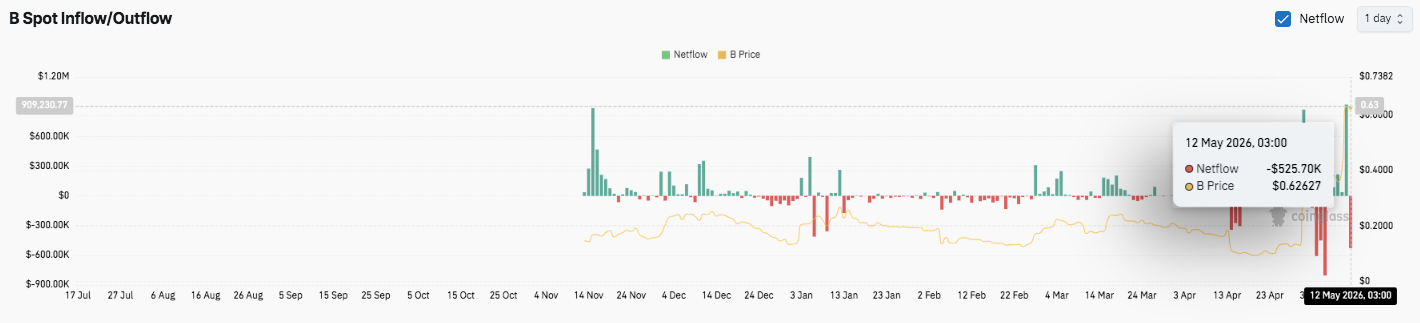
Spot inflow and outflow data also revealed unstable market sentiment. Earlier inflows supported the initial recovery trend, while repeated outflow spikes created temporary selling pressure.
Related: Pi Network Price Prediction: Smart Contracts Launch May 15 as 18.1M Pioneers Complete KYC
The latest session recorded a net outflow near $525,000 despite the strong price rally. Hence, some traders may be moving holdings away from exchanges while maintaining bullish expectations.
Technical Outlook For BUILDon (B)
Key levels remain critical as BUILDon holds its explosive breakout structure after a strong multi-week rally:
Upside levels: $0.65–$0.68 remains the immediate resistance cluster after recent rejection near local highs. A confirmed breakout above $0.70 could accelerate momentum toward the $0.80 psychological target, with extended upside potentially opening the path toward the $0.90 region.
Downside levels: $0.55 serves as the first short-term support during pullbacks. Below that, the $0.48–$0.50 area remains the key trend support aligned with the EMA 20 cluster. If selling pressure intensifies, price could revisit the $0.40–$0.45 Supertrend region, while $0.33 stands as the deeper structural support zone near the EMA 100.
Resistance ceiling: The $0.70 level remains the major breakout barrier for medium-term continuation. Flipping this zone into support could strengthen bullish momentum and attract additional speculative participation.
The broader technical structure shows BUILDon transitioning from a prolonged accumulation phase into aggressive price discovery. Strong open interest growth and elevated trading volume continue supporting bullish sentiment. However, rapidly expanding leverage also increases the probability of liquidation-driven volatility.
Will BUILDon Continue Higher?
BUILDon’s short-term outlook depends heavily on whether buyers can defend the $0.48–$0.50 support region while maintaining momentum above $0.55. Sustained strength above these levels could encourage another breakout attempt toward $0.70 and potentially $0.80.
Additionally, rising open interest above $130 million reflects growing market confidence and speculative positioning. Exchange outflows during the latest rally also suggest some traders may expect further upside continuation.
However, the recent vertical rally leaves the market vulnerable to sharp corrections and profit-taking events. Failure to hold the $0.48 support zone could weaken momentum and expose the token to deeper retracement levels near $0.40 or even $0.33.
Related: Dogecoin Price Prediction: MyDoge V3 Brings DeFi And AI Agents To DOGE As Price Coils At 200 EMA
For now, BUILDon remains in a high-volatility bullish structure. Momentum continues favoring buyers, but confirmation above $0.70 will likely determine whether the next expansion phase begins.