
Following significant developments related to Telegram and the TON ecosystem, Toncoin has seen a near-parabolic rally in recent days, making it one of the most popular assets in the cryptocurrency market. One of the best short-term performers in the market, the token shot up from the $1.30-$1.40 range to almost $3 before sharply declining.
Declarations about Telegram's growing participation in the network were a major factor in the rally. According to reports, Telegram is playing a much bigger operational role within the TON ecosystem. To promote adoption and microtransactions, transaction fees were also drastically lowered.
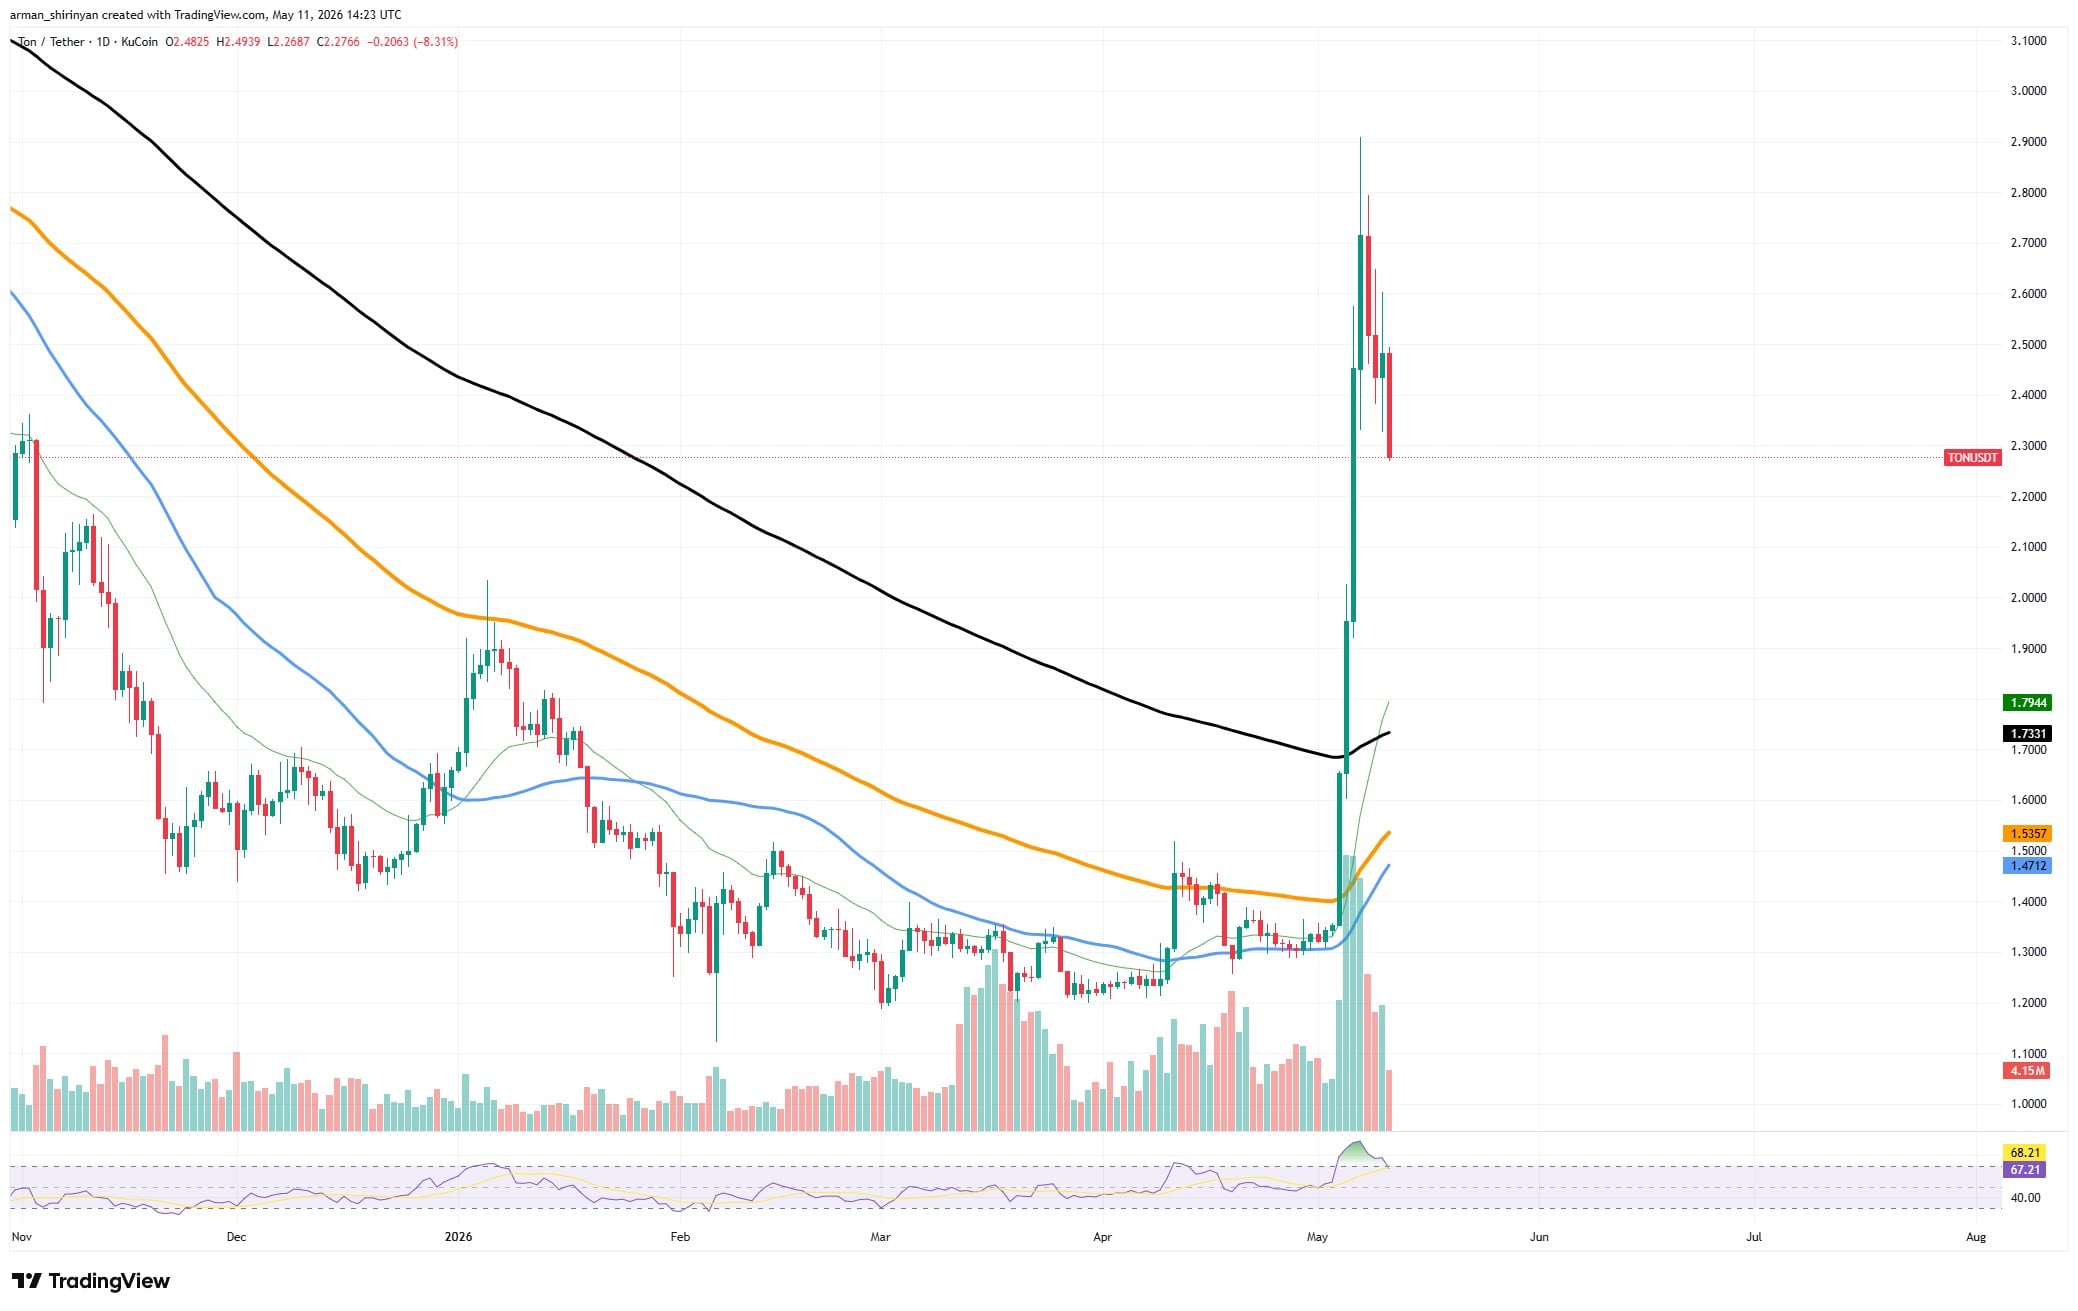
Technically speaking, TON is in a risky but optimistic stage. The chart displays a huge vertical breakout with incredibly high volume, which is the type of move that typically draws short-term speculators and momentum traders. However, markets rarely continue to rise in a straight line following such aggressive price expansion.
As volatility increased close to the local top at $2.80-$2.90, TON had already begun to exhibit signs of exhaustion. Sustainability is currently the most important issue for investors to keep an eye on. When the broader cryptocurrency market goes into correction mode, parabolic rallies frequently become vulnerable.
TON may see a very aggressive retracement if Bitcoin loses steam following impending macroeconomic events, or if risk appetite declines across altcoins. Large amounts of unrealized profit are located near the top of the move, so assets that rise the fastest usually correct the hardest. Although a significant decline is still a plausible scenario, this does not imply that TON will lose all gains.
In the vicinity of significant resistance levels, analysts are already pointing to weakening breakout volume and overheating momentum indicators. The previous breakout zone, which is located between $2.00 and $2.20, seems to be the critical area at the moment.
The rally may stabilize and move into a more robust long-term uptrend if TON is able to hold above that area. However, panic profit-taking could quickly drive the token sharply lower if market-wide selling pressure increases.
To put it another way, TON still has a lot of narrative momentum, but after making such a bold move, the current structure also carries a significant correction risk.
Ethereum's inability to break through
The market is becoming impatient as Ethereum is once again getting close to a crucial technical zone. The 100-day EMA, which has consistently rejected bullish momentum since the significant February breakdown, is still beyond $ETH's reach despite weeks of recovery attempts.
Ethereum is currently moving inside a tightening consolidation structure and trading in the mid-$2,300 range. The 100 EMA is repeatedly blocking breakout attempts on the chart by functioning as a ceiling directly above price action. $ETH has not been able to establish a convincing bullish trend reversal due to a number of unsuccessful recoveries, including the most recent rejection.
In theory, that is very important. After several attempts, failing to break above a significant dynamic resistance level typically indicates waning buying pressure. Traders start to wonder if the recent recovery was merely a relief bounce inside a larger bearish structure, or if bulls truly have enough strength to maintain upward momentum.
Ethereum is currently in a precarious position where broader market weakness could swiftly intensify downward pressure. At this point, a decline toward $2,000 is not some extreme bearish fantasy. In fact, the possibility that Bitcoin will lose steam, or that macroeconomic conditions will worsen following the release of inflation data, is growing more plausible.
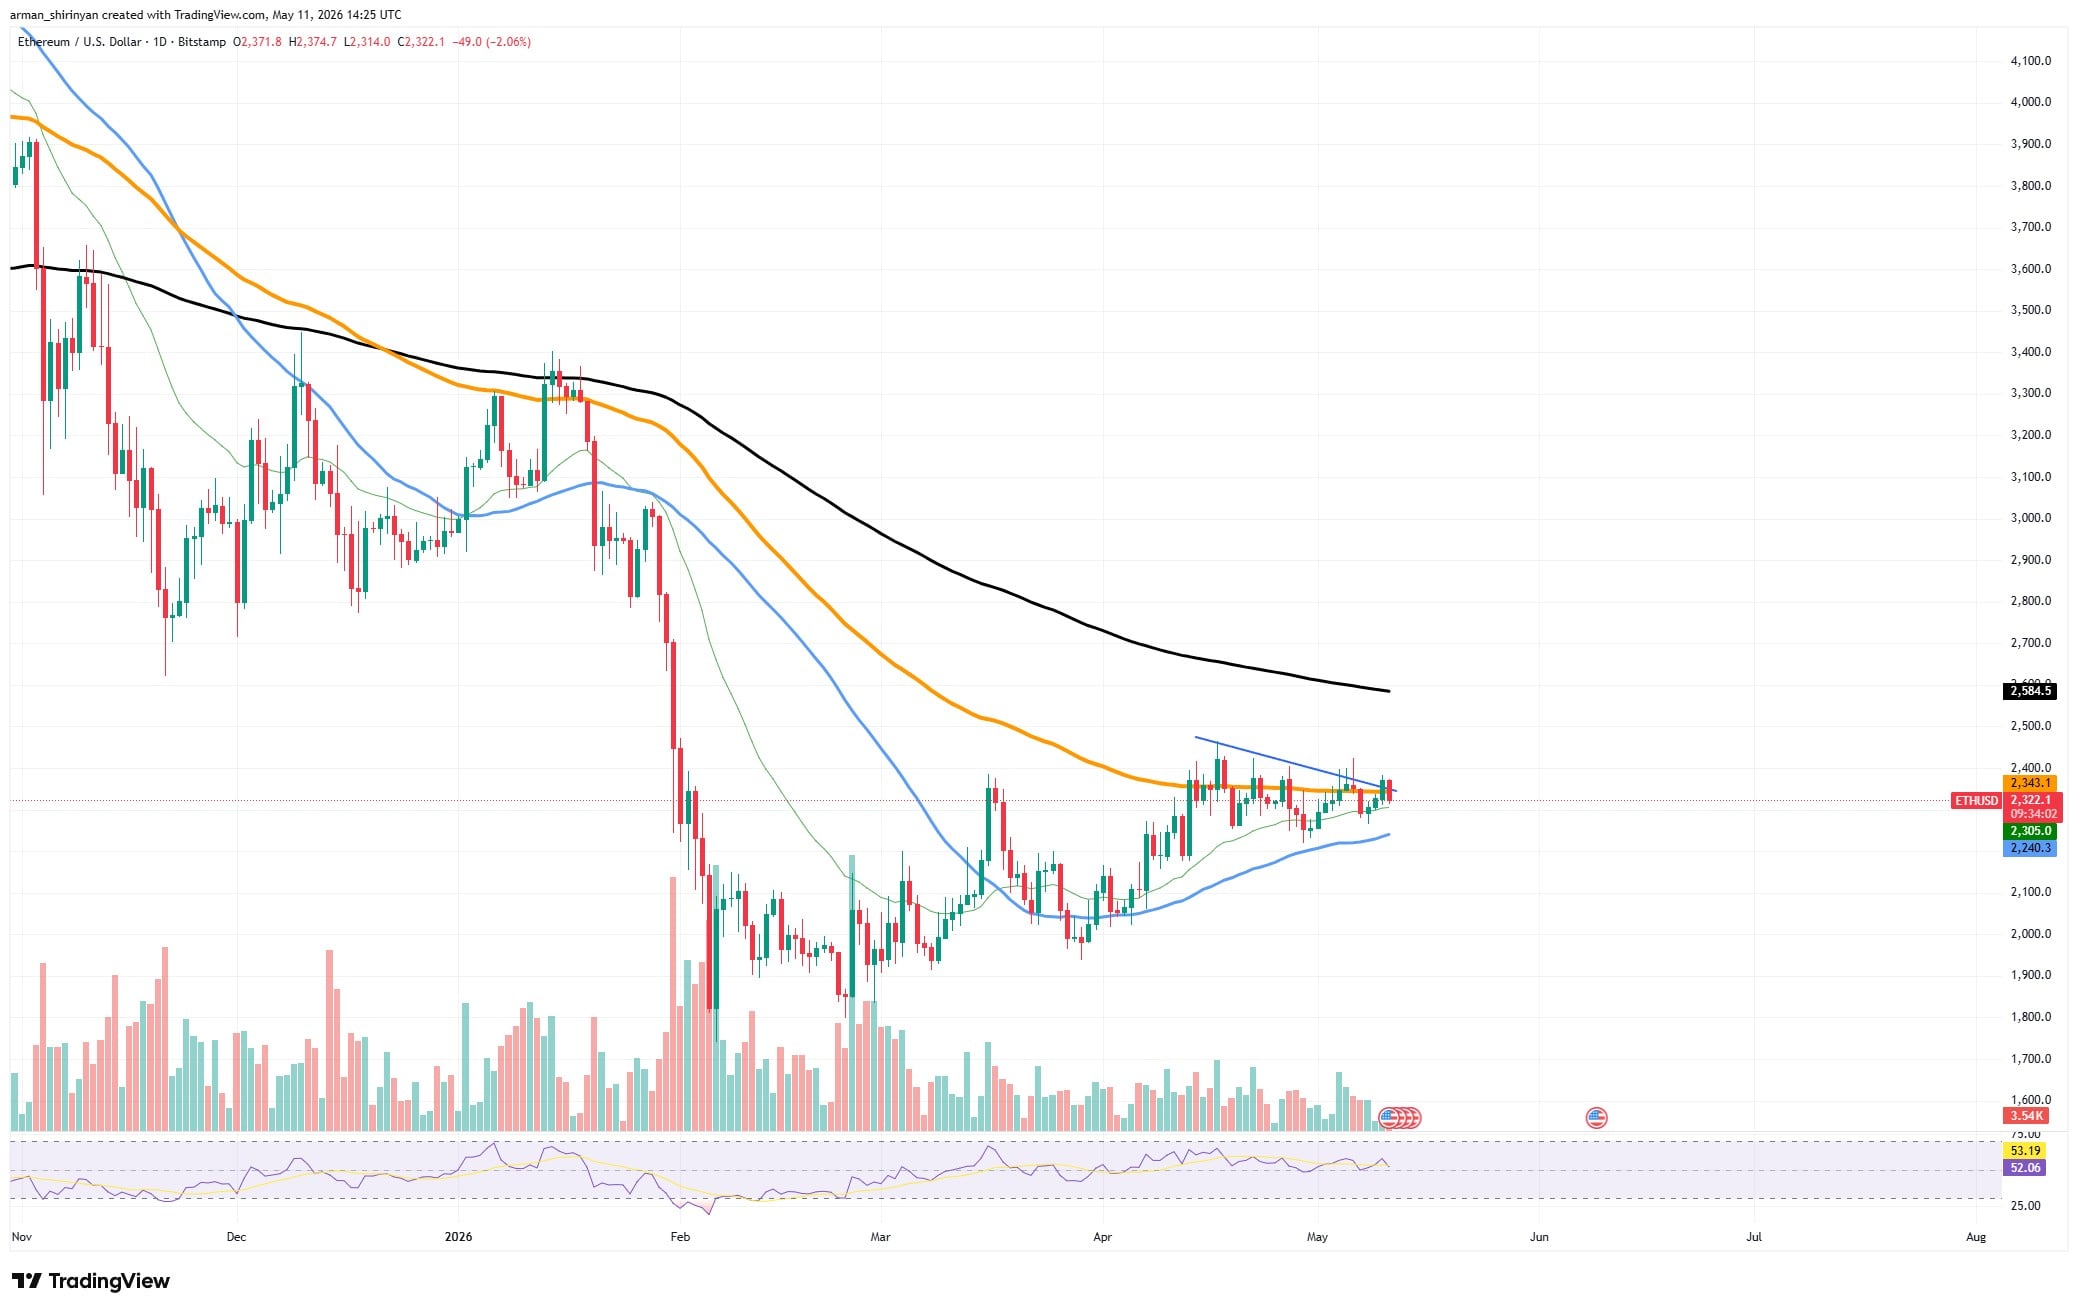
In contrast to Bitcoin, Ethereum continues to appear structurally weaker over longer time horizons and is still strongly correlated with general market sentiment. The volume behavior is another problem. Aggressive follow-through was lacking in recent breakout attempts, and the RSI is still largely neutral rather than exhibiting significant momentum expansion.
Before volatility resumes, that combination frequently emerges during periods of exhausted consolidation. The market may swiftly shift toward psychological support close to $2,000 if $ETH loses support in the $2,250-$2,200 range. Because traders see that level as a boundary between recovery and resurgent bear-market conditions, it also has significant emotional significance.
Shiba Inu finally breaks through
As the meme asset continues to gain momentum close to a crucial breakout zone, Shiba Inu is displaying some of its strongest technical structure in months. $SHIB is now getting close to a crucial resistance cluster that could dictate the course of its next significant move after being stuck in consolidation for weeks.
After progressively rising from its March lows, $SHIB is currently trading close to the $0.0000066 region. The way the recovery has progressed is what makes the current setup significant, not just the price increase itself. This rally has developed a much cleaner ascending structure, with consistent higher lows and improved stability across short-term moving averages, in contrast to earlier brief spikes.
In a technical sense, $SHIB is in its best state since the beginning of March. The 100-day EMA, a resistance level that has frequently stifled bullish continuation throughout the broader downtrend, is shown on the chart as $SHIB pushing directly beneath it. While volume is still comparatively healthy and RSI is still rising above neutral territory, price is currently compressing against that barrier. Volatility expansion events are frequently preceded by that combination.
To put it simply, $SHIB is no longer acting like a freefalling asset. It's obvious that momentum is changing. The daily chart's tightening wedge structure is another bullish indication. $SHIB has been rising steadily as buyers continue to defend higher support levels. If overall market sentiment stays steady, breakout probability typically rises as assets get closer to significant resistance in this type of compressed formation.
The possibility of continuation is also supported by the larger cryptocurrency market. Risk appetite for speculative assets has increased as a result of Bitcoin's recovery above major moving averages, and meme coins typically react severely when momentum shifts back into high-risk industries.
A significant break above the 100 EMA may pave the way for $SHIB to enter a much longer recovery phase. Reclaiming that level would be the first notable bullish trend shift since the March breakdown, so traders are already waiting for confirmation.